Why does smaller box size give better resolution?

Hi,

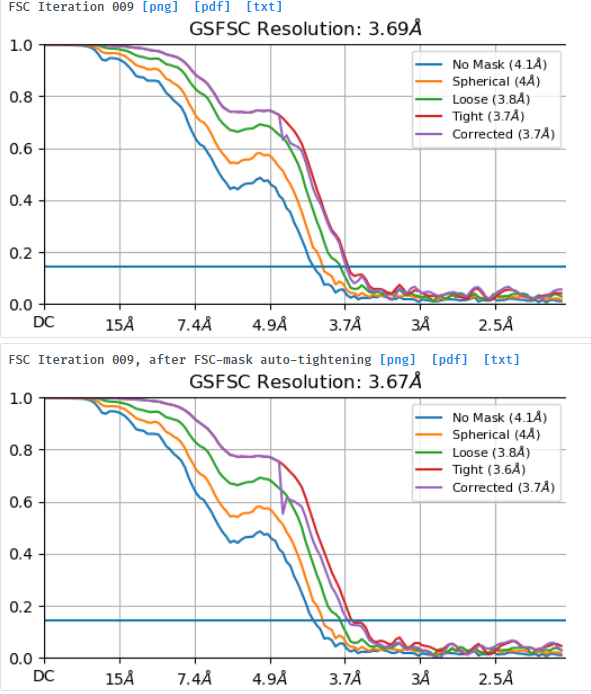
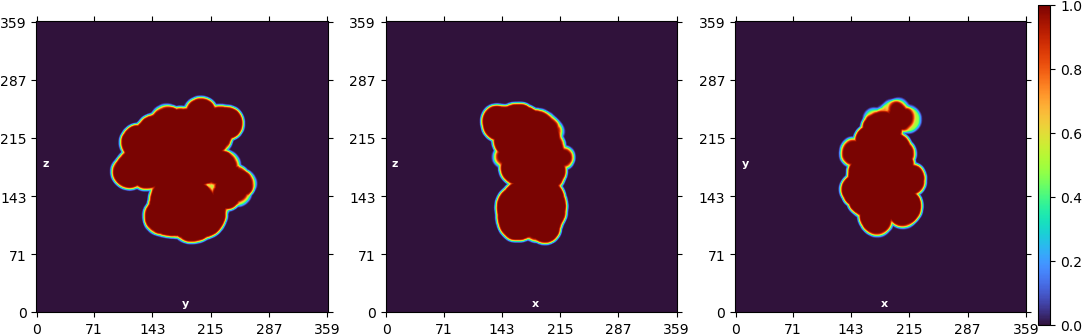
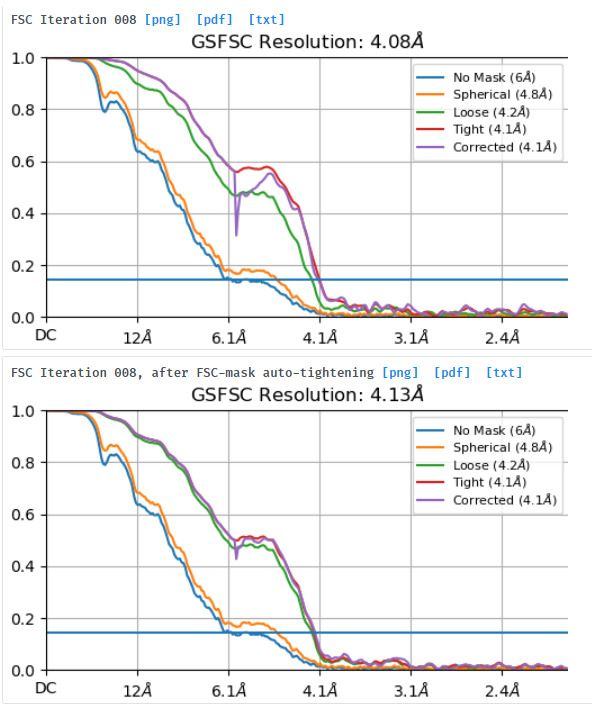
I am processing a dataset that was collected at -1.8um to -3um defocus and am trying to understand why a small box size of 280pix gives better resolution (3.7A resolution) and FSC curves than a box size of 576pix (4.1A resolution). I extracted the same particle stack twice and only varied the extraction box size (pixel size was kept at 1.06apix) before performing NU-refinement on both stacks with the same dynamic masking width. My particle is a glycosylated dimer with two floppy domains and a diameter in the longest dimension of ~220A.

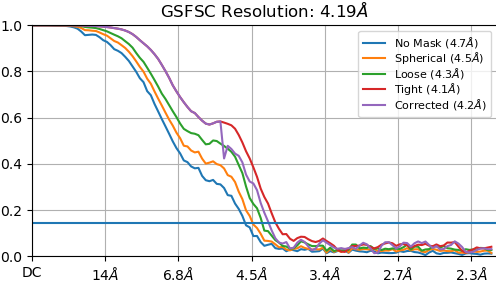
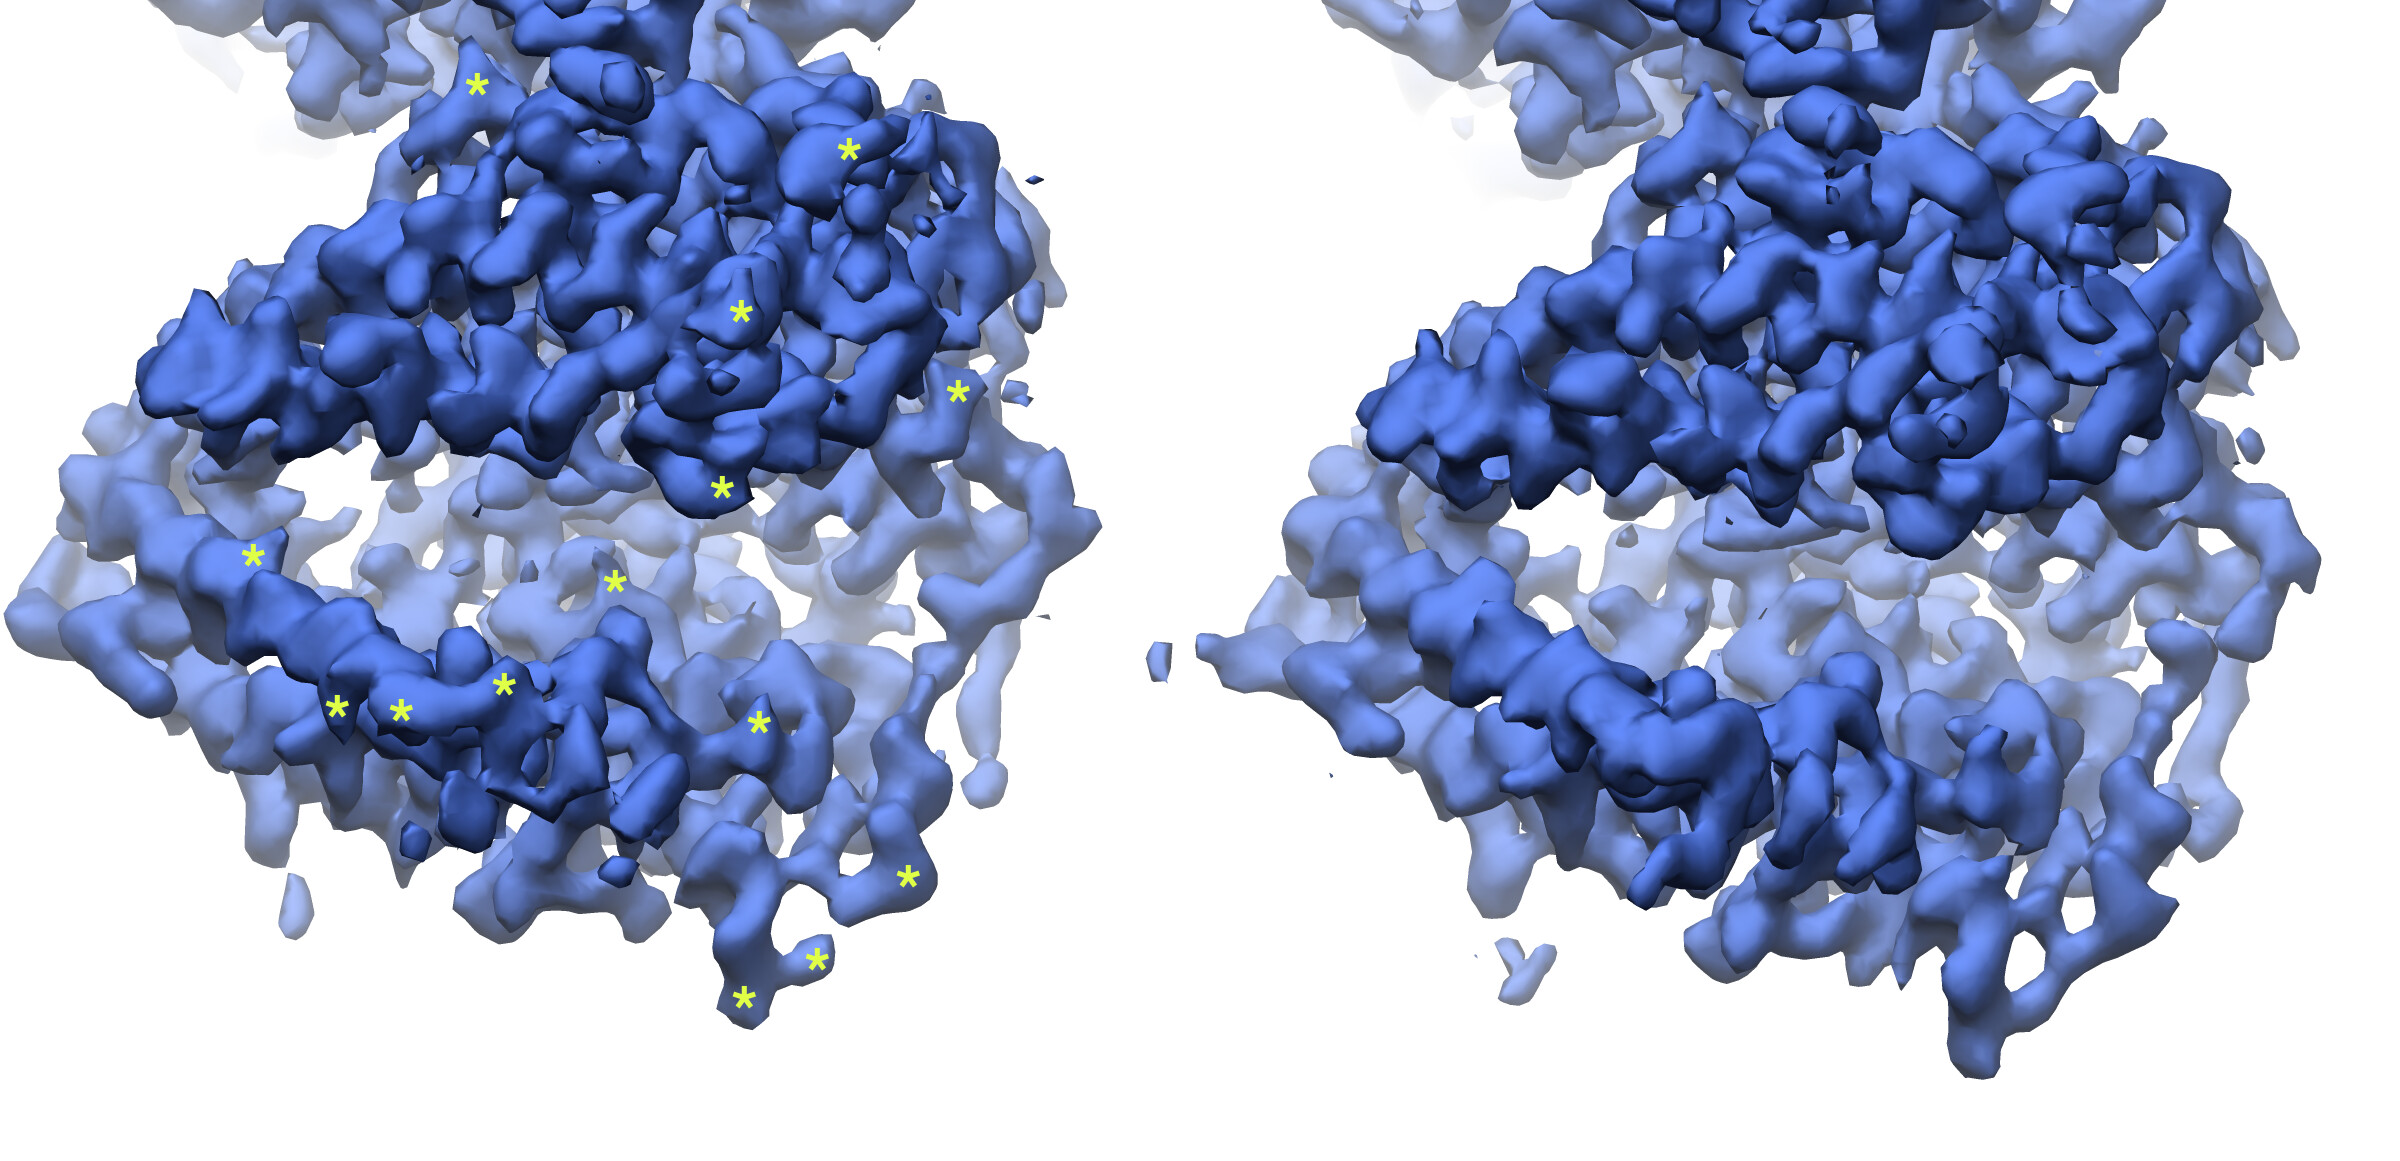
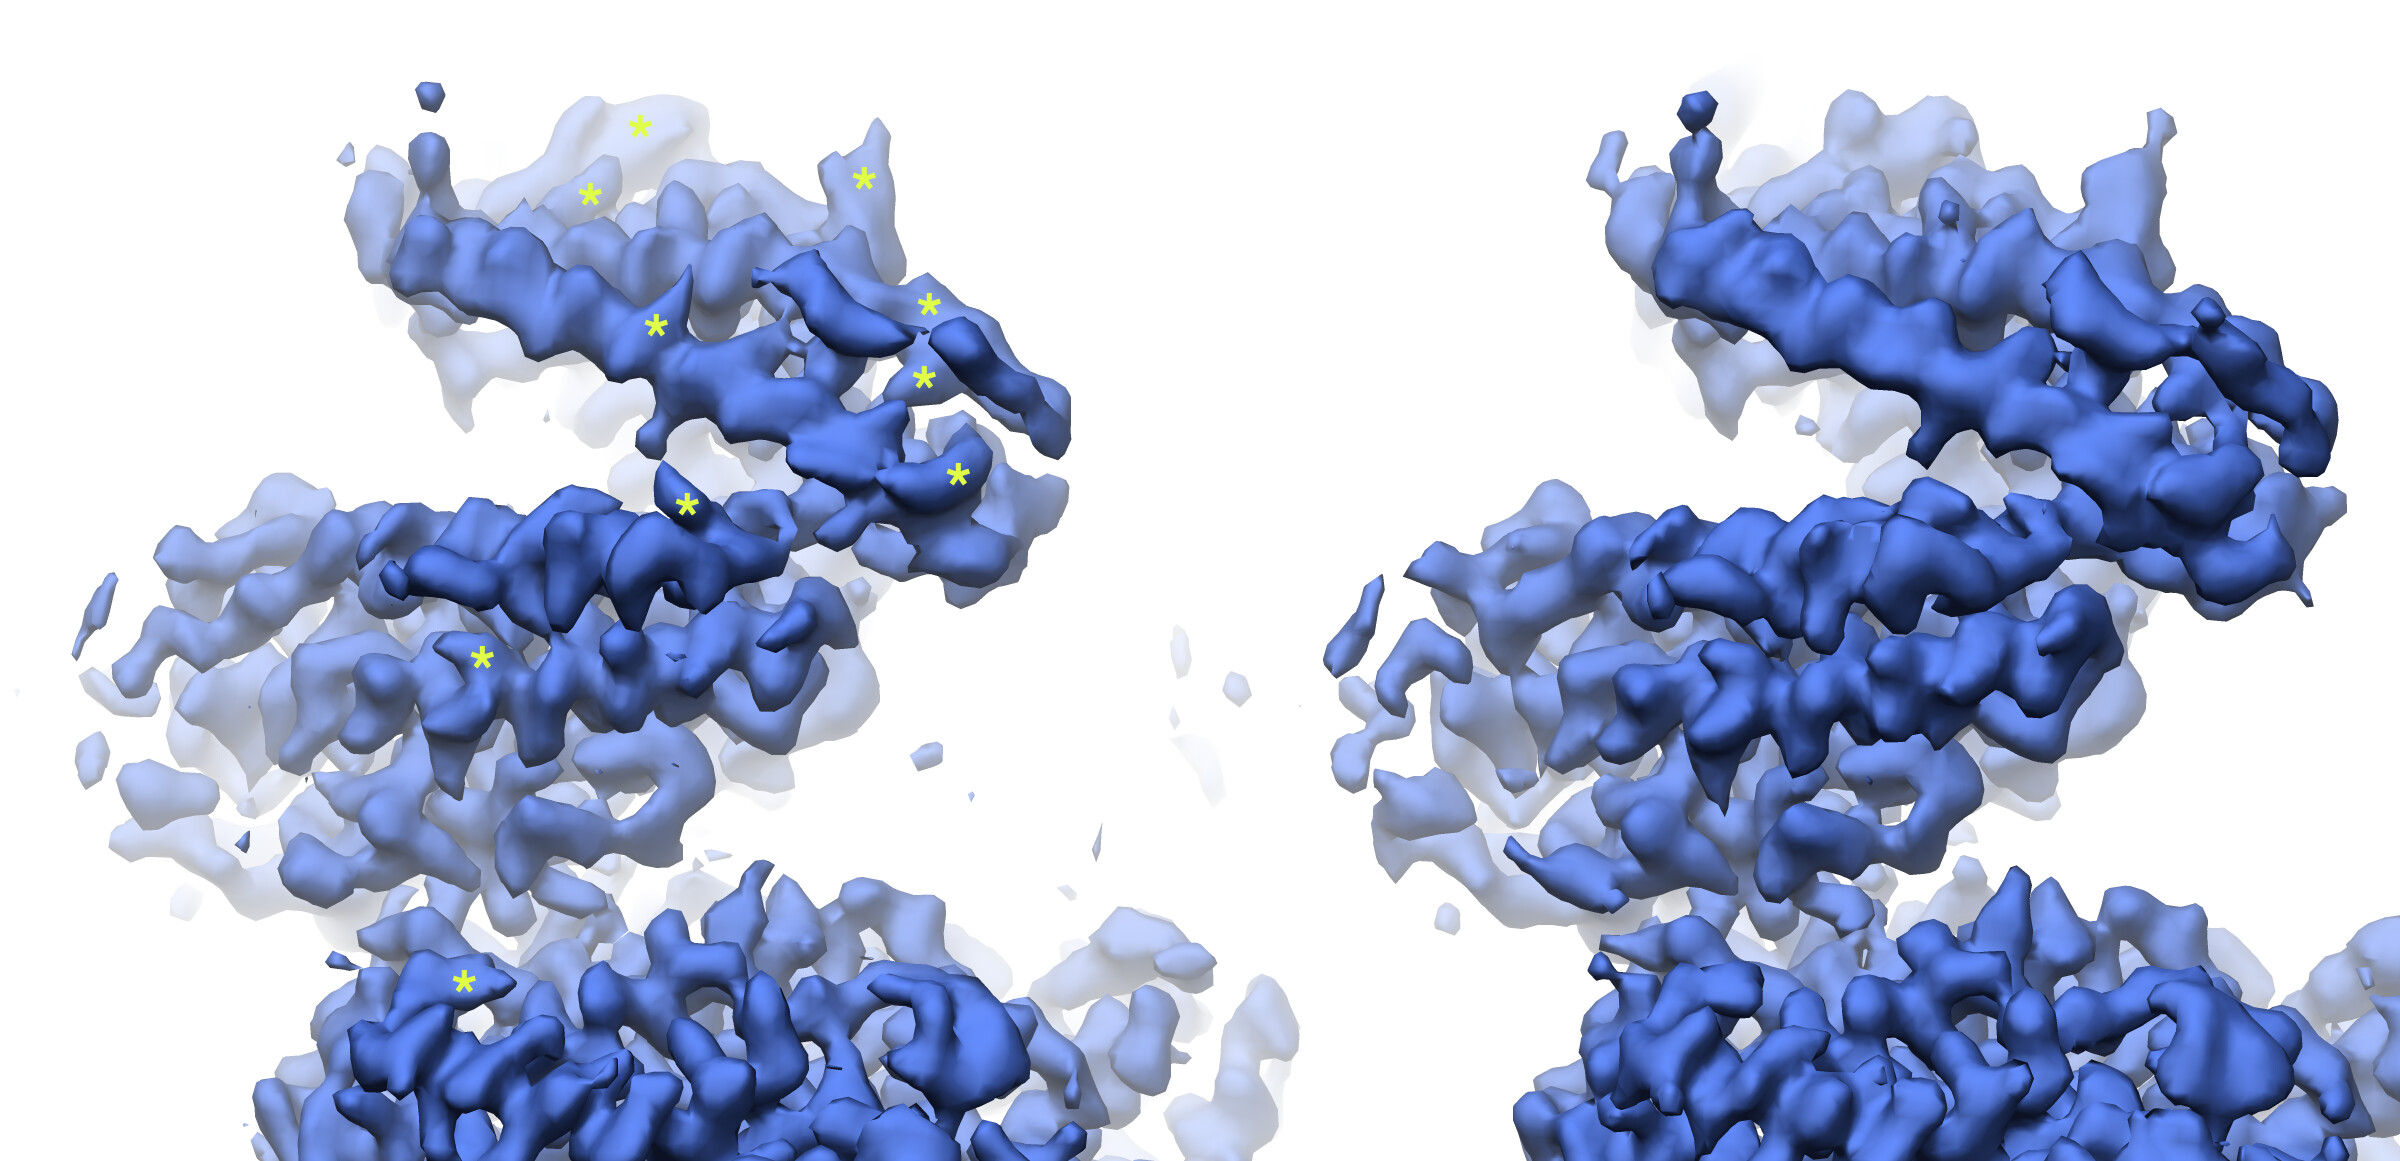
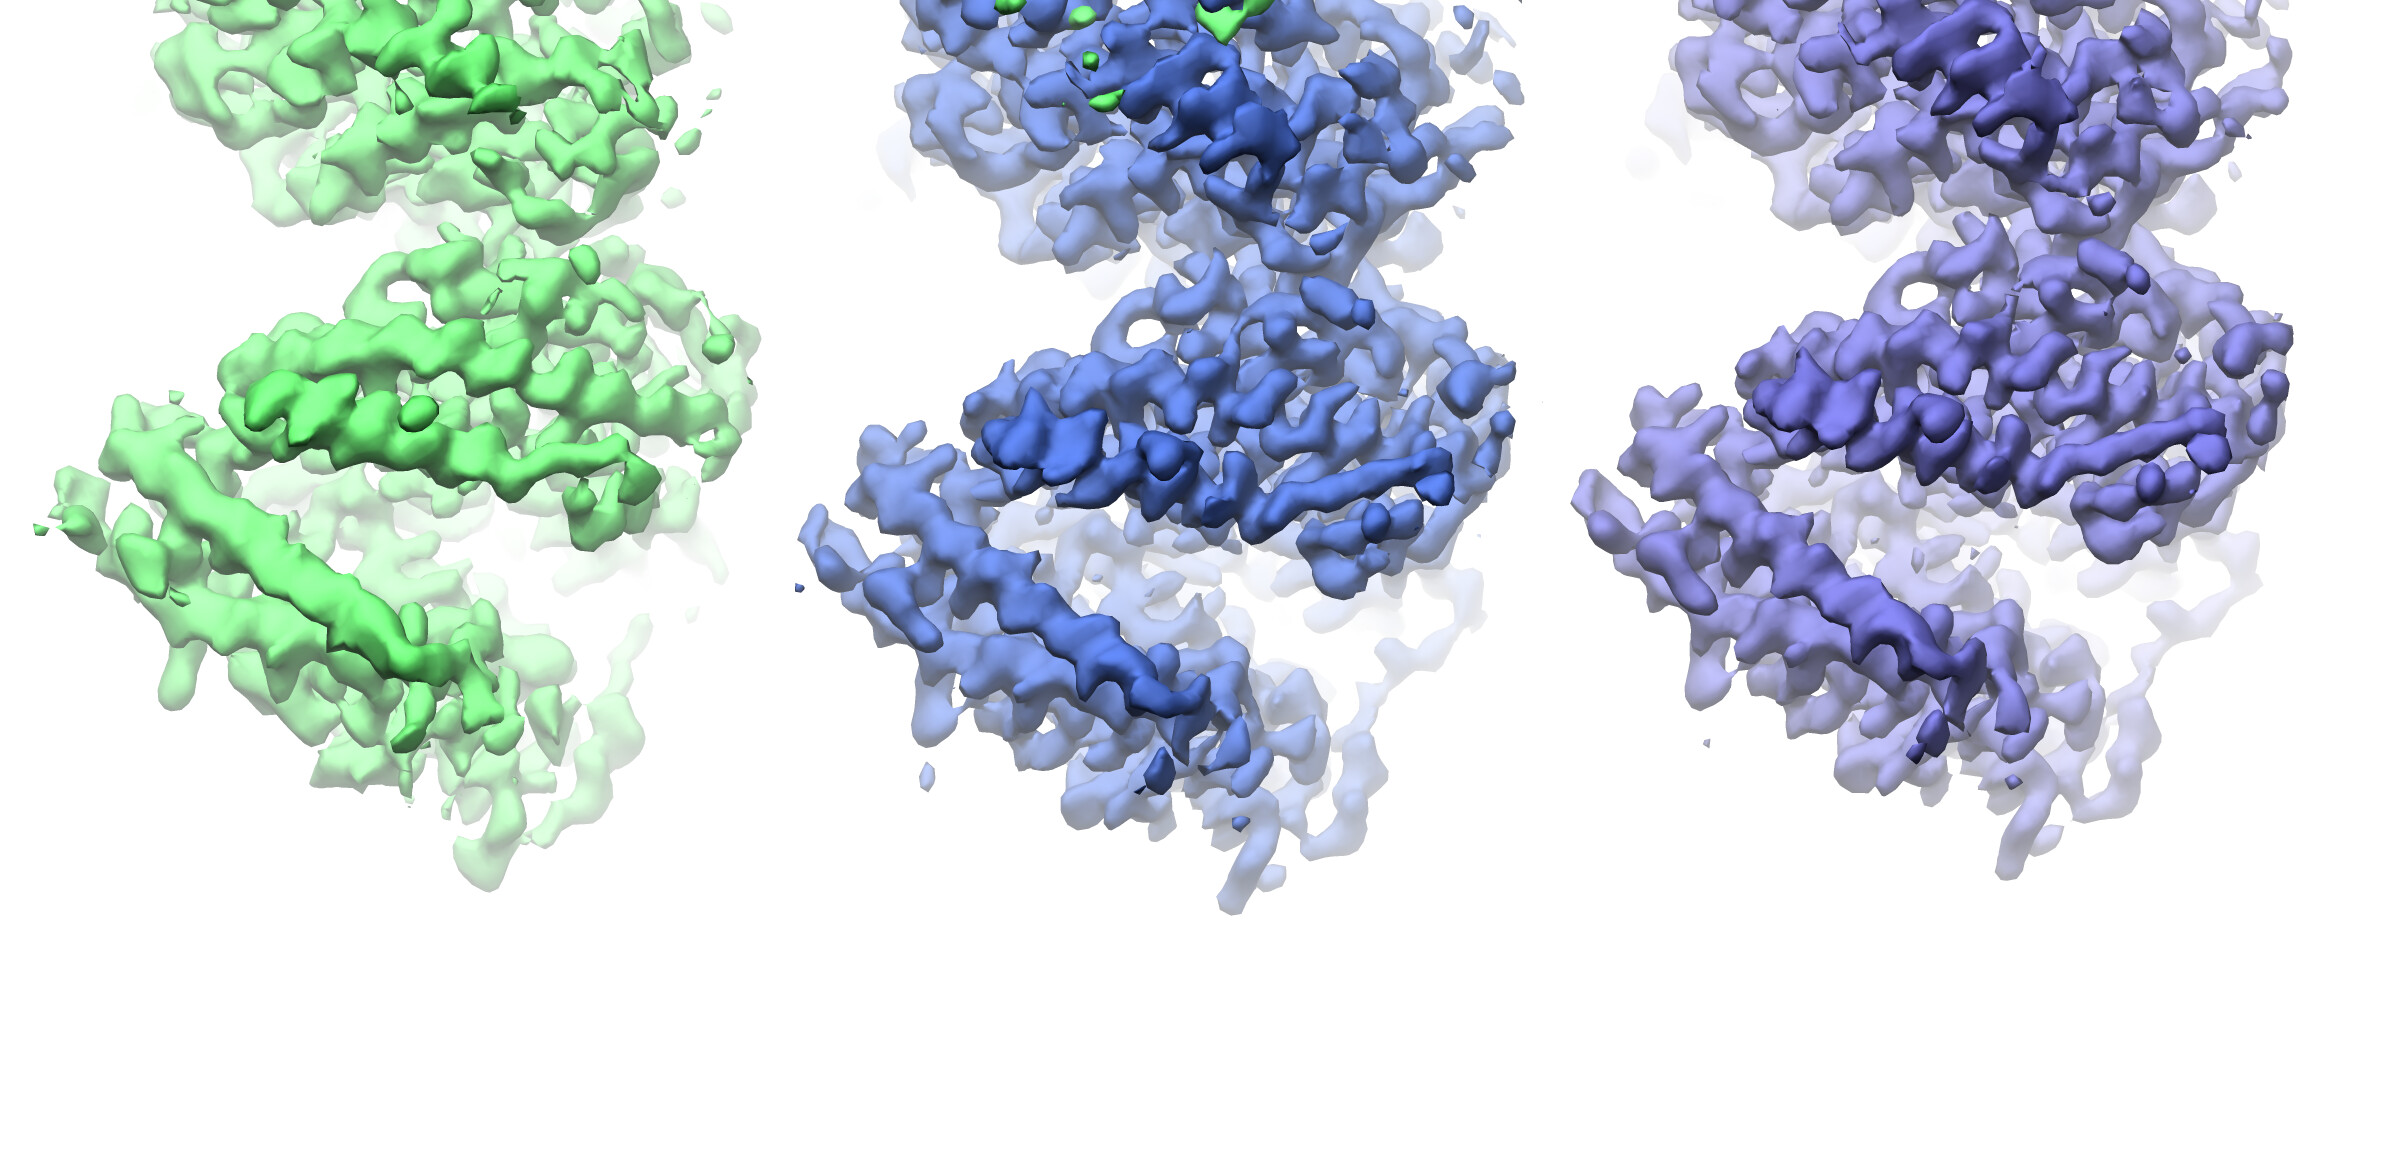
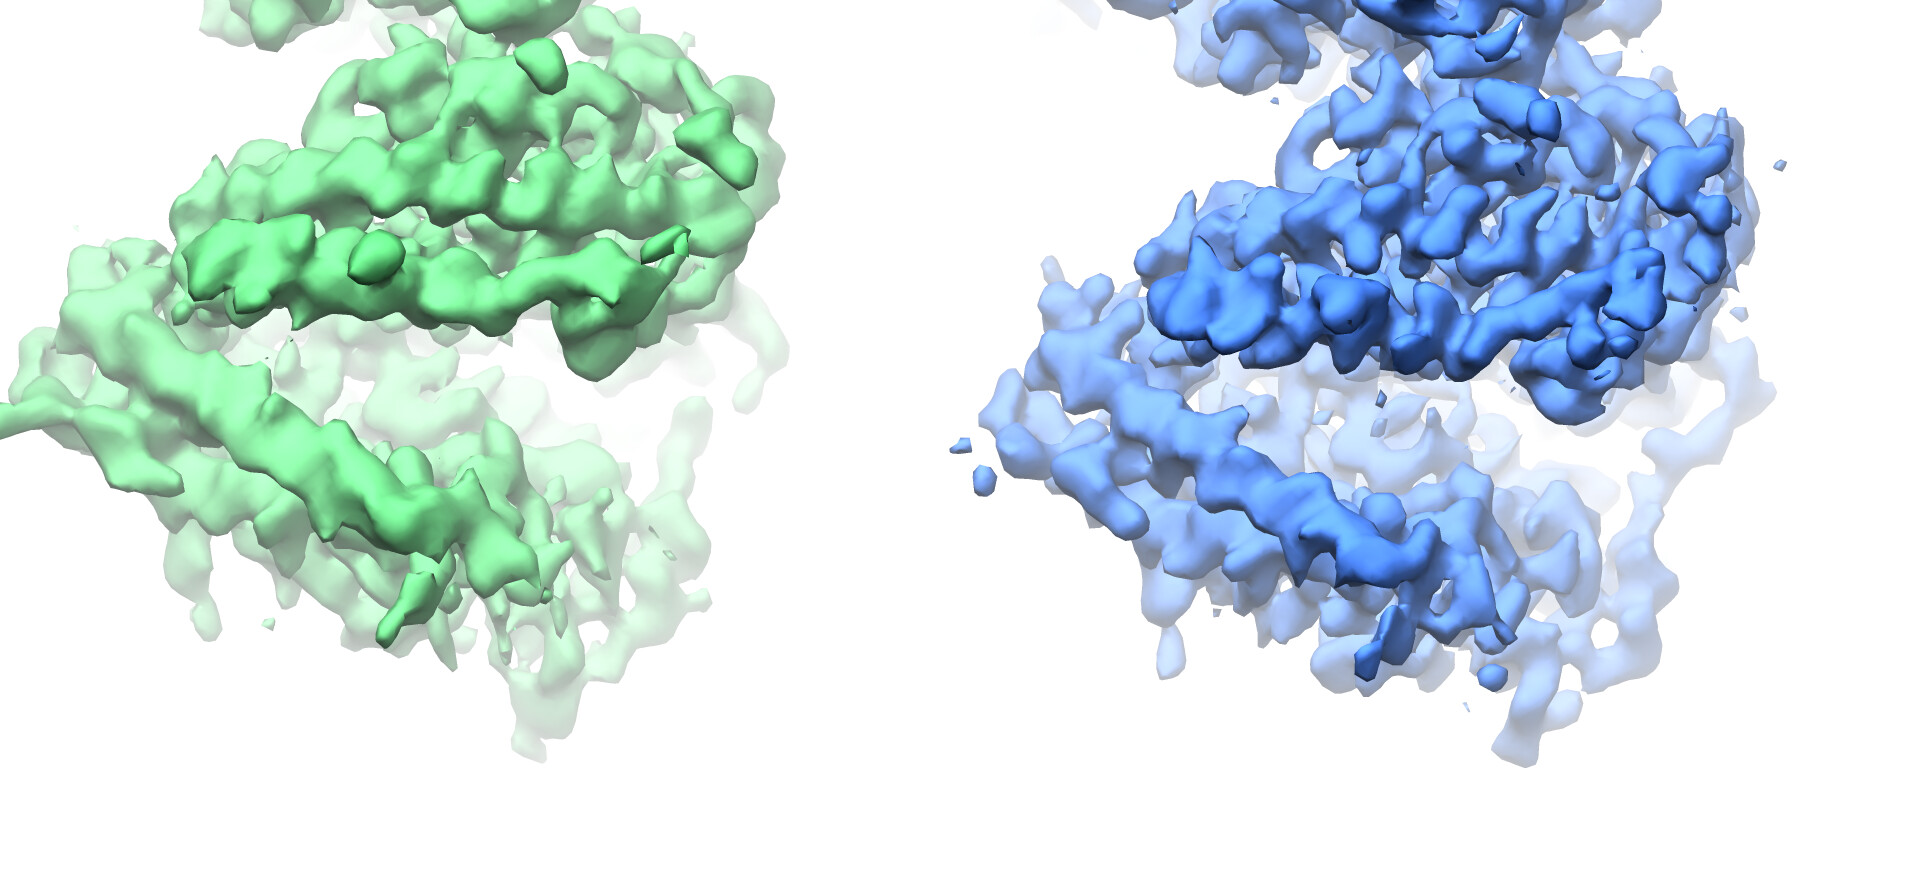
Looking at the maps, I do feel like the improvement in resolution is real:
Green = 576pix box; blue = 280pix box

As mentioned by @olibclarke in this post Cannot align small protein complex particles - CryoSPARC Parameters - cryoSPARC Discuss, the box size to use (in order not to lose information delocalized due to the CTF) is:

B=D+(2XLX(dF/D) (from Rosenthal & Henderson JMB 2003)

I collected data using a Titan Krios thus L ~0.02Å at 300kV.

According to this, should the resolution not increase (or perhaps just stay the same) instead of decrease when I increase the box size?
I thought that a smaller real-space window applied during NU refinement may minimize the effect that an increase in solvent would have on the alignment. Is it possible that the increased noise in a 576pix box in the Fourier domain negatively affects alignment?

What would be the recommended way forward? I feel like the smaller box with better curves should be the obvious choice but want to understand why this happens before moving on.

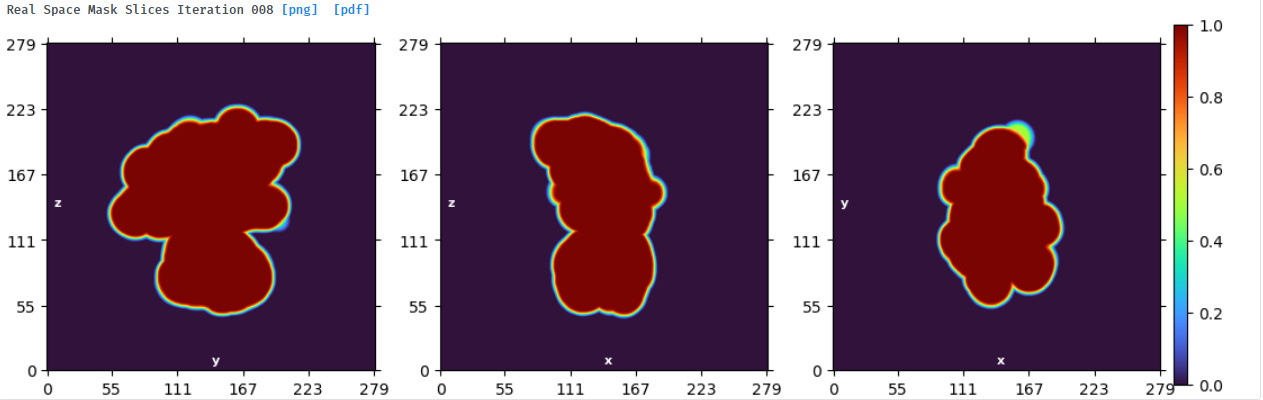
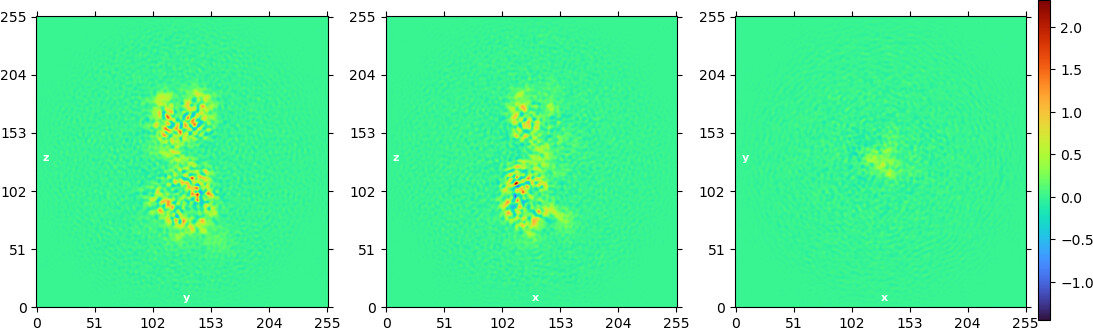
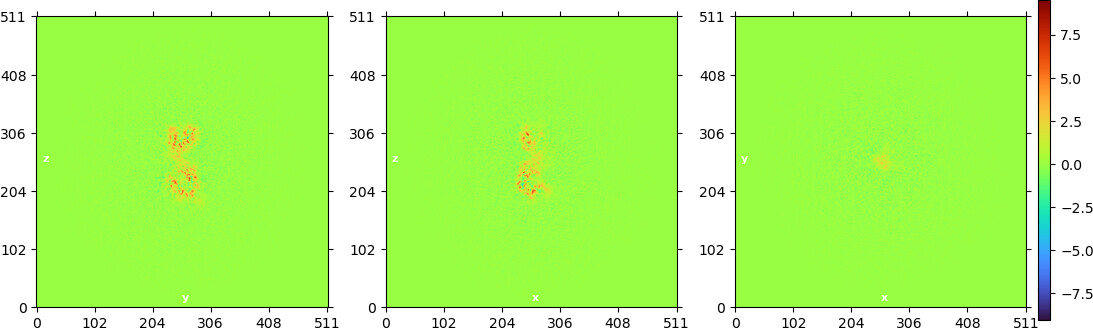
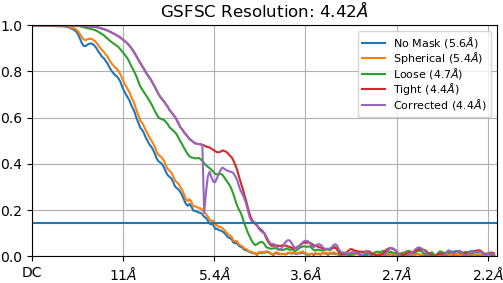
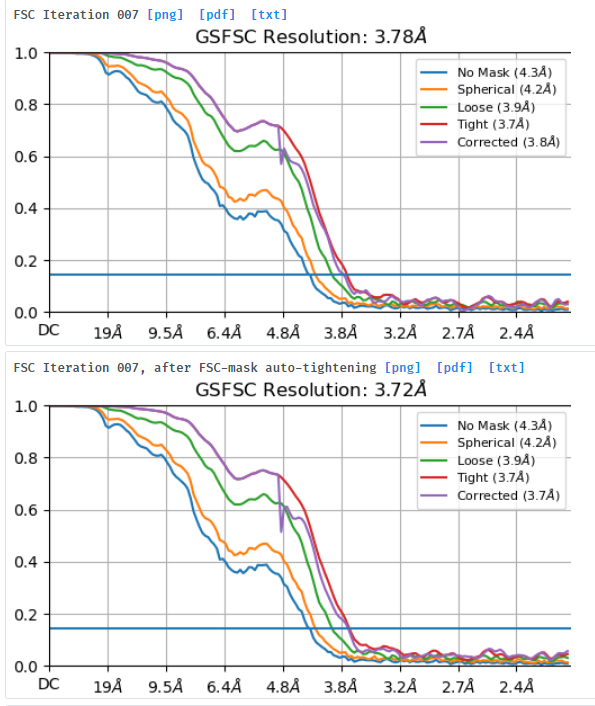
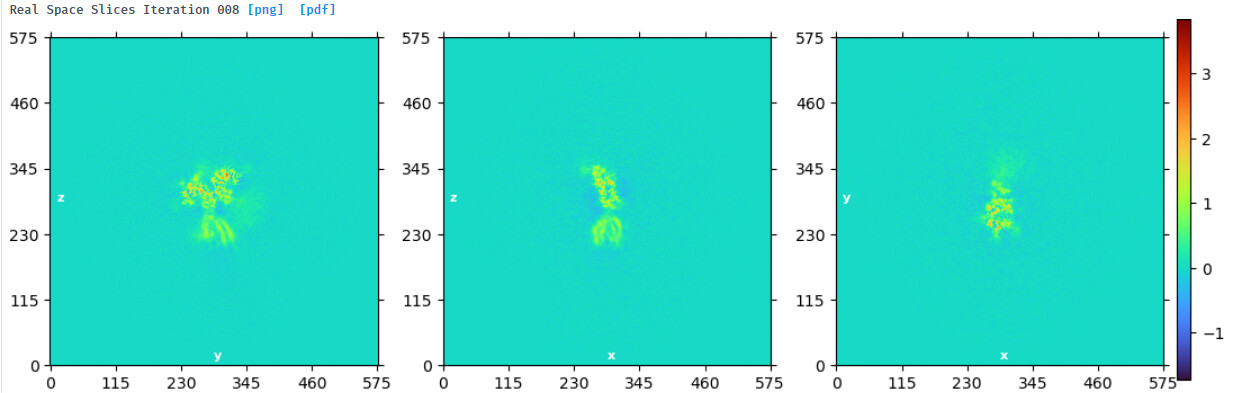
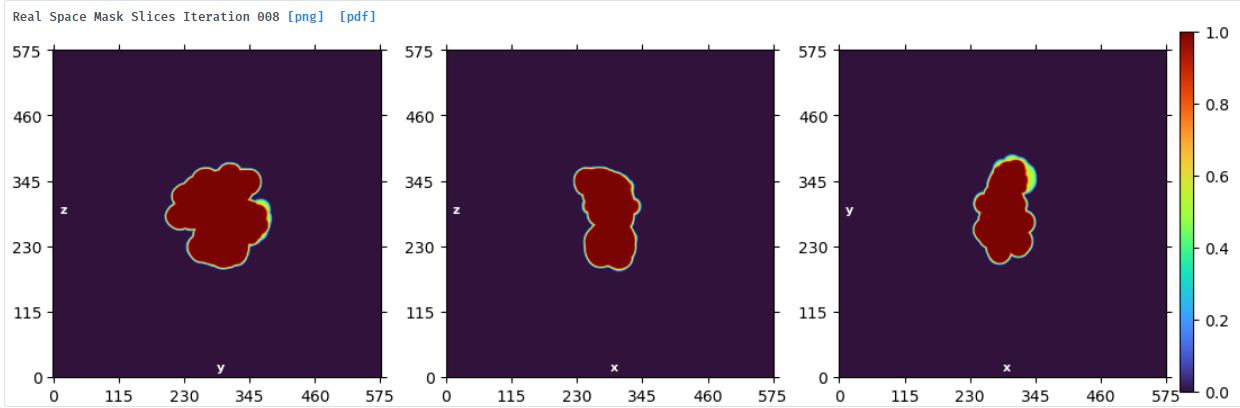
NU refine in 576pix box (real-space window of 0.6-0.75):


NU refine in 280pix box (real-space window of 0.85-0.99):


2 Likes

Hi @lizellelubbe,

This is an interesting post! One potential factor contributing to the discrepancy could be the number of particles in each stack. Since extraction filters out particles that (upon extraction) will exceed the edge of the micrograph, larger box sizes will result in less particles extracted, although you likely have considered this already. In any case, what is the difference in the number of particles in the large vs small box size stacks?

Other than that, there’s a fair number of internal parameter choices that are dependent on the box size, and it’s possible that one of those could also be contributing to the resolution discrepancy. For example, the final precision (i.e. step size) in particle alignment shifts is technically proportional to the box size: for a larger box size, shifts are sampled more coarsely (although, this was tuned to go well beyond the alignment resolution needed for most datasets). Also, the initial iterations of branch-and-bound alignment start at a constant radius in Fourier space, which was also tuned on a large number of real datasets, and it’s possible that the tuning wasn’t aimed at very large box sizes relative to the particle size.

Your point on there being more noise in the Fourier domain also definitely makes sense, and could also definitely be a cause. I think practically it makes sense to go ahead and use the smaller box size result, as long as CTF aliasing is not an issue at the box size you’ve chosen (This is a useful utility from the RELION developers to visualize what the CTF looks like with your parameters).

Best,
Michael

2 Likes

Thanks for the helpful reply @mmclean!
I was not aware that cryosparc extraction filters out the particles at the micrograph edge and that explains why my particle stack decreased in size during an earlier extraction - thanks for clarifying :slight_smile:
In this case, however, this did not apply. I first extracted in the large box, refined and used that as input for the extraction into a small box so both stacks have the exact same 130675 particles. The only reason why I did this was so that the box size would be more computationally efficient for 3DVA - in hindsight I could have used the downsample particles job but in the end this was a fortunate ‘mistake’ since the small box gave me better alignment.

Regarding the precision, do higher values mean that the alignment is more accurate or is it just using finer shifts?

This is for the small box with higher resolution:

This is for the large box with poorer resolution:

The scale bar goes higher for the small box refinement.

Given that the protein is so flexible due to hinging and also motion of the large amount of glycans, any additional solvent noise is probably detrimental to the alignment.

I have tried the CTF tool from Takanori and just want to check if I understand it correctly.
I have no idea how to extract the CTF values from the .cs file so used pyem to convert it to a star file and used the following to calculate the average defocus U ($10), defocus V ($11) and defocus angle ($12) from the star file. I then used these values as input on the CTF calculator tool.

count=0; total=0; for i in $( awk '{ print $10; }' from_csparc_P7J208_ctfcalc.star ); do total=$(echo $total+$i | bc ); ((count++)); done; echo "scale=0; $total / $count" | bc

Using this, I got an average defocus U of 18602, average defocus V of 18393 and average defocus angle of 12.
I’m assuming astigmatism angle in this tool is the same as defocus angle?

My input for this tool was: defocus 18497A, astigmatism 104A, astigmatism angle 12, energy 300kV, Cs 2.7mm, phase shift 0, amplitude contrast 0.1.

For a box size of 280 at 1.06apix and ring at 3.7A:
image

For a box size of 576 at 1.06apix and ring at 3.7A:

Is it acceptable to use the 280 box??

Or should I rather use this 360pix one?

It seems like the smallest box where aliasing is a bit less pronounced. A 360pix box may not suffer as much from increased noise (or whatever the cause of decreased resolution was) as the 576pix box. I also have a monomer reconstruction from this same dataset and suspect that it may also suffer from the increased noise. The resolution of that refinement also decreased when increasing the box size though at around 4A, it is difficult to judge how important that is by looking at the maps.
The monomer top view is half the diameter of its side view and only around 60A in the centre of its 256pix box (or 512pix if using the Rosenthal and Henderson equation for choosing a box size). It is also glycosylated at the top and bottom of the monomer so in the 3rd panel from NU refine below, the map is just a tiny blurred spot even in the 256pix box.

256pix box NU refinement of monomer:

image

512pix box NU refinement of monomer at 1.06apix:

image

Perhaps I should use a box of 360pix for both the monomer and dimer reconstructions?

For a particle with these characteristics, would it be recommended to do future data collection closer to focus?
It was very difficult to see particles on the micrographs even after applying Topaz denoising which is why we chose higher defocus for the current dataset.

Is it worth noting that the FSC does not go completely to zero for the “higher resolution” reconstructions? There is certainly more detail in the 3.7 A map but I wonder if filtering to the same frequency for both maps would yield similar results.

Hi @lizellelubbe,

Unfortunately what you observe is not a fluke. I have seen the same behavior in both cryoSPARC and Relion. You can fix this issue in Relion using CTF premultiply + crop option during Bayesian polishing to pre-correct the CTF values with a large extraction box and it will spit out cropped images that are pre-CTF corrected, which is both useful for what you observe and also computational less expensive to do the further refinement steps. Unfortunately, cryoSPARC does not seem to have this option. I think @mmclean is right that parameters that depends on the extracted box size cause this. However I think all those parameters should better be dependent on a value (like the circular mask in relion) that user provides (default can be 2/3 of the box size).

@lizellelubbe you’re definitely right about the alignments. You can see those streaks around the edges of the particle in the worse map, for example. This kind of thing should really be expected most of the time, because the spatial extent of the box sizes is really significantly different (~2x or ~4x as much area), so the particles are not really commensurate with one another in terms of the background. Especially for 3DVA, the smaller box is definitely what I would choose (and for model building until the larger box refinements catch up in resolution).

You can see from the CTF images that the aliasing is probably not really affecting these refinements. The other benefit from the bigger box would be capturing signals delocalized by the CTF - a potential concern at higher defocus, but again seemingly not the limiting factor. (You still have a range of defocus values, and today’s CTF envelopes are less severe at high defocus). You might be able to improve the refinements in the larger boxes by forcing more iterations, or though continuing with local refinement (including of the whole particle).

Have you tried using conventional template picking on the low defocus images you do have? You might find a range of -0.5 to -1.5 or -2.5 to be sufficient. I’ve seen some very good structures come from very low contrast datasets.

Thanks for the very informative discussion @mmclean, @Ablakely, @alburse, @DanielAsarnow!

@Ablakely, I also saw that there is a ‘hill’ on the FSC curve of the 280pix box refinement where it crosses the threshold but didn’t know why or what to do about it. Do you have any idea why that happens? With the large box refinements I always saw more jagged FSC curves and often the drop to zero was more gradual. I intuitively thought it was due to more background noise which affects alignment since @apunjani has mentioned in a previous post that for flexible proteins, the drop to zero can be more gradual but I don’t understand how that can affect the FSC. Do you have any thoughts?

I have since done re-extraction of the dimer (the exact same particles from the first stack in this post’s thread) in a 360pix box at 1.06apix and performed NU refinement. The resolution is basically the same but the curve now doesn’t have this ‘hill’ and the map has slightly changed. In the 280pix box the map has some regions with spiky edges (marked with yellow stars) and these are more rounded in the 360pix box map (on the right). But maybe these changes are completely insignificant and I should choose the 360pix map just because the curves are better and chance of ctf aliasing effects are less? BTW how would I recognize aliasing effects on a real-space map?

Volume_map_sharp from the 280pix box (left) and 360pix box (right) with * showing some slight changes:


Plots for the 360pix box NU refinement:


I have tried to filter the 280pix map from before to the same resolution of the 576pix map using relion_image_handler --lowpass. Is this what you meant @Ablakely? I used --lowpass 4.1 on the 3.7A map and got this (green is the 576 box map at 4.1A, blue the 280 box map at 3.7A and purple the 280 box map filtered to 4.1A):


I don’t see much change after lowpass filtering to 4.1A and it still looks better than the reportedly 4.1A map in green - this seems strange…

@alburse, I have never done Bayesian polishing in Relion but thanks for the suggestion. It is good to know that others have observed this as well. Although, of course, it is not good that these discrepancies occur. After reading your last comment I’m assuming that re-extraction in Relion with a small mask size for normalization would not help to circumvent this problem during cryosparc refinement? Would cryosparc still set the refinement parameters based on the box size?

@DanielAsarnow, thanks for pointing out those streaks in the worse map - I didn’t even see them! I agree that the particles are not really the same since the background is very different. This is probably why the noise variance plot axis is larger for the large box refinement. I am glad you agree that the small box size should be used :slight_smile: The monomer is obviously even smaller and its alignment also suffers in a large box with lots of noise. Thanks for the tip on local refinement of the whole particle, that may be worth a try. Do you think I could even use a mask which cuts off the glycans but keeps the whole particle to align the underlying protein better with local refine?

I have tried to use template-based picking on all my micrographs with a FoM of >0.05 in CTF-find after excluding ones with ice rings (most images had max res of >4A). My particle stack of the consensus refinement only has around 30k particles from images at defocus of 0.8-1.5um. Given that there are different conformations in this stack, I don’t think that dividing it into a subset based on defocus would be an option. But it was a good suggestion - thanks!

Unfortunately, As of CryoSPARC 2.14, those CTF pre multiplied particle stacks cannot be used in cryoSPARC refinements with at least usual parameters. I have not tried on the latest versions. @apunjani @mmclean Is there a way to turn off CTF correction during refinement to use CTF pre-multiplied particle stack from relion?

Hi @alburse
I really do want to perform my refinements in cryosparc since NU refinement is better than Relion refinement of the glycoprotein. If the option you mentioned is not available in cryosparc I may just carry on with the 360pix box for the dimer.
Since the decrease in resolution that I am seeing becomes more pronounced as the solvent to protein ratio is increased, would this also negatively affect local refinement after signal subtraction? Following 3DVA, I want to mask out the two floppy domains of the dimer and locally refine the interacting domains but then, even in the 376pix box, they would occupy a tiny volume relative to the solvent.
I haven’t studied local refinement yet so apologize if this is a very naive question!

1 Like

@lizellelubbe based on what you’ve said - it seems then the defocus is a non-issue? And therefore for a future large dataset, a defocus range of -0.5 to -1.5 (or maybe 2.0-2.5 max) would work. High defocus range is still worse, just not as bad as would have been when CTF envelopes were worse. Unless you collected the same number of images < 1.5 um and ended up with wildly fewer particles. I assume you are using a Krios at ~64kx nominal mag based on the pixel size.

You should try whatever mask you think might help and judge the results based on map quality in the regions you care about most! In other words, do whatever makes it easiest to build your model. It is very hard to predict what will work and what won’t, but fortunately cryoSPARC is pretty fast so you can explore the parameter space and different masks, etc. without worrying about whether it’s “worth it” to try.

Also, run the same refinement a couple of times and compare the results - you will see they are not the same (even if you use the same random seed). Any conclusion about different refinement parameters should only be drawn in the context of the expected variation from repeating refinement with the same parameters. With regard to the spikiness of the 280px map, that is likely just appearances, try vop resample #N spacing 0.53 to see if it looks smoother. Coot actually always resamples the map, the default factor is 1.8 I think.

CTF aliasing would in theory just be another b-factor that attenuates the high resolution signal, so if it (or delocalization) were significant/limiting then the bigger box size would have given a better result. Also, about the FSC dip, that is likely an intrinsic property of the shape of your protein (you would have to dig down and look at its radial power spectrum, and also consider the orientation distribution, to be sure). Finally, the FSC curves are generally less smooth with the bigger boxes because the spectral resolution is higher (same Nyquist frequency, more samples).

PS I understand you may be limited by particle count, but the best way to improve resolution at this point is very likely 3D classification in Relion or cisTEM using some combination of masking and alignment settings (no alignment, or certain fineness or resolution limit). You can come back into cryoSPARC to clean things up with NU afterwards. Another thing that might help the larger boxes is one more round of 2D classification, to throw away particles which have too much background in the big box.

5 Likes

Hi @DanielAsarnow, thanks for the kind reply.
I am still new to cryo-EM and working remotely from home so appreciate all the feedback I have received on this forum :slight_smile:
The data was collected on a Krios at 0.53apix in super-resolution mode with 81k nominal magnification and binned 2x during motion correction. I will keep on experimenting and definitely want to try 3D classification on the consensus 130k particles after 3DVA. Thanks again!

1 Like