Dear CryoSPARC team, I have a small question regarding the average power spectra job. Apart from using the in-plane angles to align the segments vertically, calculating their PS after padding, and summing those PS, are there any other steps done ? For example, are there any attempts to better align the PS ? I have a strong signal in a PS sum that shouldn’t be there (I know the symmetry), and I’m trying to figure out where it could come from…
Thanks much in advance,
Ambroise
Dear @adesfosses,
Thanks for your question. No – as of the latest CryoSPARC version (4.5), nothing else is done – the particles in each 2D class are padded, PS computed, rotationally aligned, and summed together.
Could a possible explanation be related to the 2D class having residual out-of-plane tilt? We have received a feature request to allow 3D alignments in this job for that reason (although this requires a previously refined structure)
Best,
Michael
Dear Michael,
thanks for your clear reply. It must come from something else, likely a “contamination” of those classes by segments corresponding to another symmetry (in this case out-of-plane can’t cause this signal). Just wanted to check that there was no attempts to align the PS other than using the existing in-plane rotation.
With best wishes
Ambroise
Dear Michael,
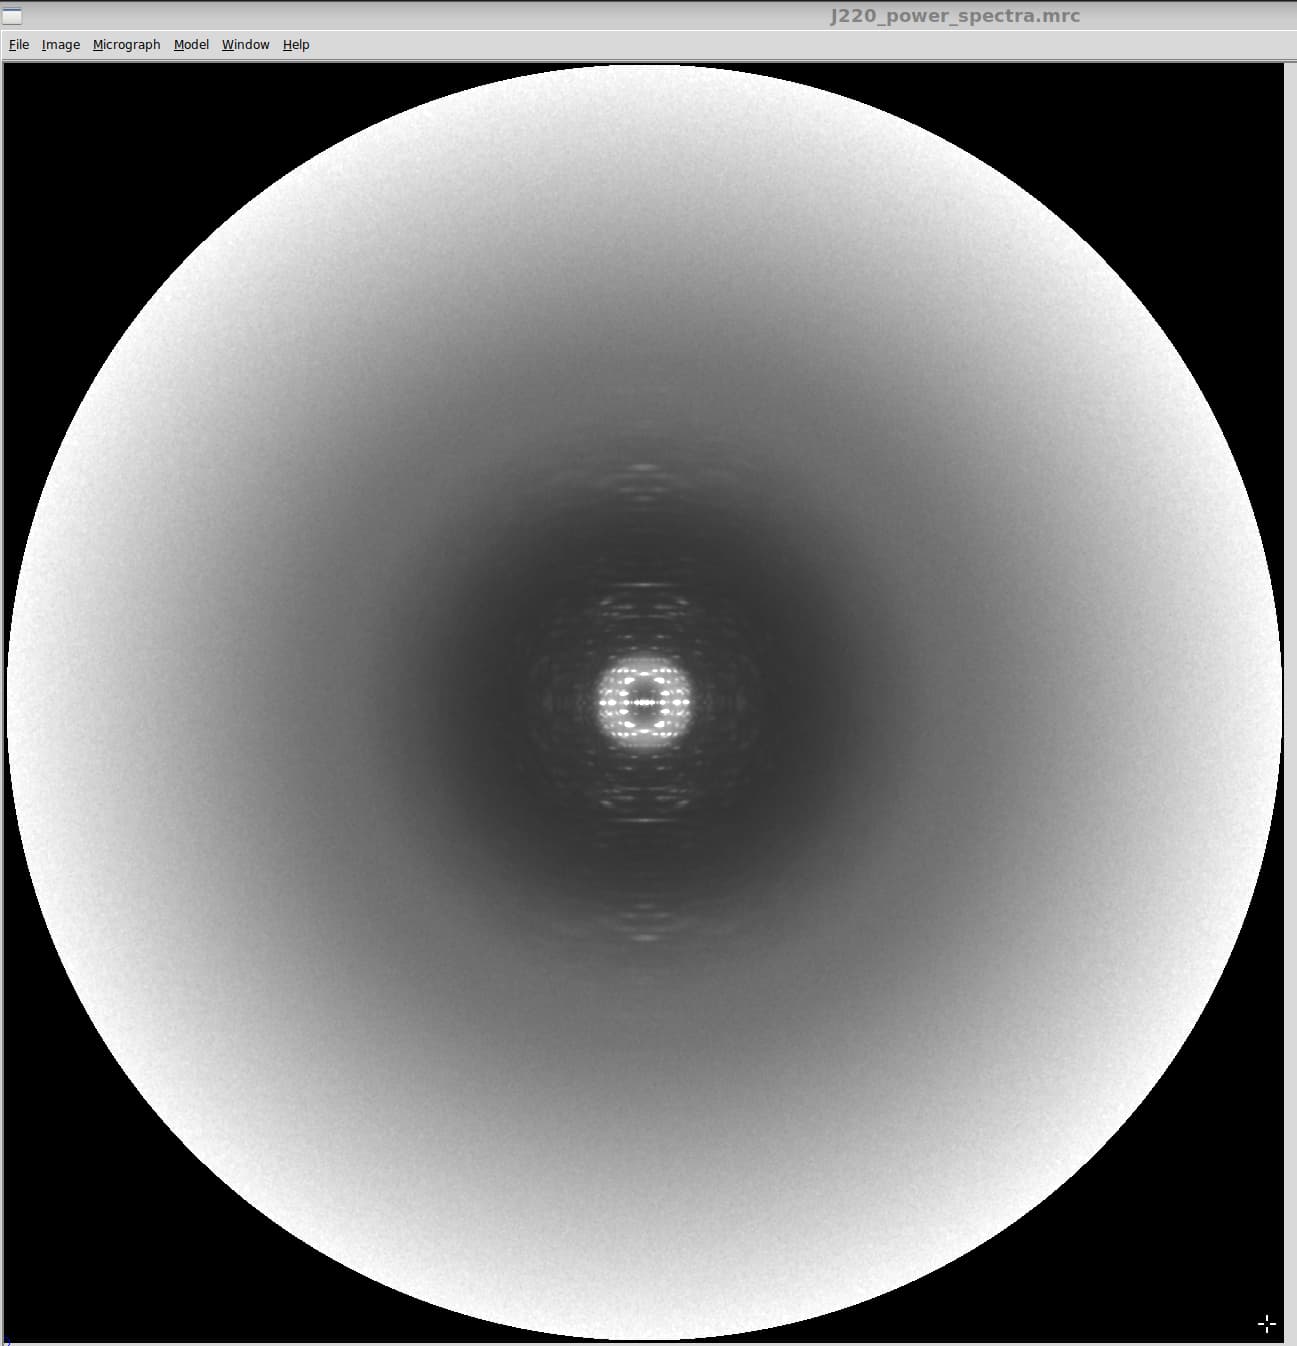
are there also not any attempts of “normalizing” the output PS or compensating for amplitude decrease ? I often see stronger signal (white area) at high res than at middle resolution, which is not really as expected, as well as other unusual distribution of grey values across the different resolution ranges. Thanks for confirming ![]()
With best wishes
Ambroise
Dear Ambroise,
Thanks for bearing with me again. The power spectra shown in the jobs Event Log are shown in logarithmic scale (rather than linear scale). The .mrc images of the power spectra written out to the job directory are raw values (not logs) of the summed power spectra across all particles in the given 2D class. Is it possible that this difference explains the relatively high strength of signal at high resolution that you are observing, if you are seeing this in the Event Log images?
The only other factors that I have yet to mention that are worthy of noting are:
- particles are windowed in real space according to the windowing parameters in the job;
- bilinear interpolation is used to rotate each image’s power spectra before summing them together.
It may be worth changing the interpolation order from 1 to 3 and seeing if the described artefacts disappear. Thanks for reporting and I hope this information may be helpful to discern what may be going on.
Best,
Michael
Dear Michael, thanks for your reply. I was initially surprised -in my second question- by how strongly the amplitudes rise at high resolution (see the image), but it is actually present in the raw images too, and seems to be characteristics of recent datasets (I guess this is the NPS ?). The only issue with this is that since helixplorer is based on the grey values of the pixels to calculate the score associated to a particular symmetry, it is harder to get a usable score with such PS. Maybe a solution, in addition to outputting the normal sum of PS, would be to calculate the baseline of the amplitude variation, and subtract this baseline in a “baseline corrected” PS ? Like in eq 1 of Influence of electron dose rate on electron counting images recorded with the K2 camera - PubMed ?
In any case, cryosparc did not introduce anything that was not in the data, sorry for bothering you !
Thanks for the help
Ambroise
Hi @adesfosses,
Thanks for bearing with me. One other thing is coming to mind that may explain the increased amplitude at high resolution. In motion correction, dose weighting is done to upweight earlier frames at high resolution, and to downweight later frames at high resolution. However, at low resolution, frames get a closer to uniform weight. This is described a bit more on our guide pages.
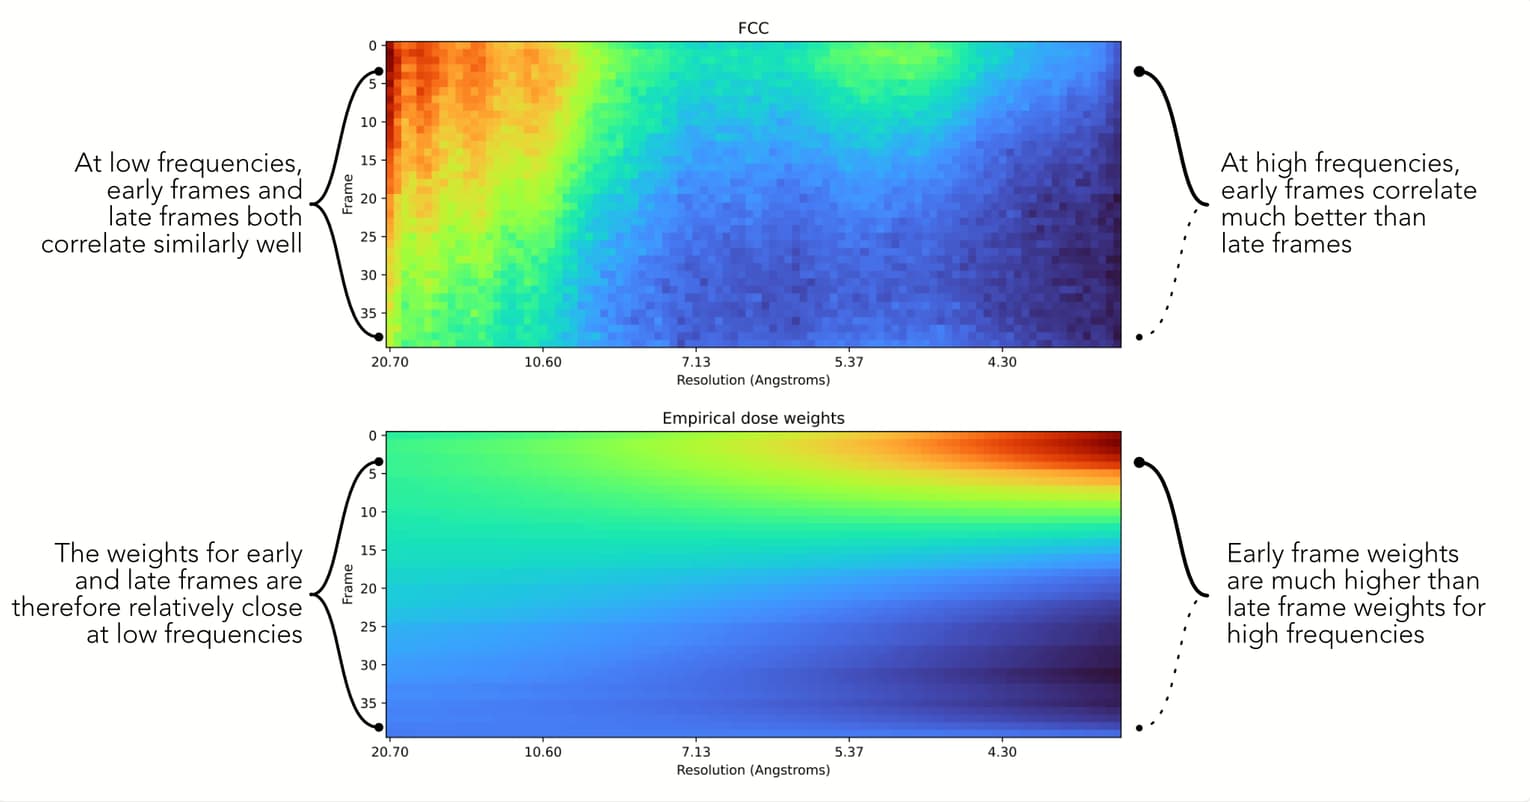
This means that at high resolution compared to low resolution, there will be a larger variance in the noise in the images. This may be the underlying reason why there is a larger amplitude variation at high resolution (the power spectrum you’ve shown growing “whiter” near the periphery of the box)
I was thinking something worth trying could be to average together particle images that have been extracted without dose-weights applied. If you completed motion correction in CryoSPARC, there should be an output result of motion correction called micrograph_blob_non_dw. It might be worth trying to re-extract particles with this result overridden using the low-level results interface (described by Rich here), and then re-run 2D Class and Average Power Spectra.

I’m not entirely sure this would solve the increased amplitude at high resolution issue, but perhaps it is worth trying. If it doesn’t resolve it, my apologies I couldn’t be of more help
Best,
Michael
When it is stated:
“the particles in each 2D class are padded, PS computed, rotationally aligned, and summed together.”
how is the rotational alignment done? I have previously raised that it appears that the power spectra themselves are being rotationally aligned, as opposed to using the rotational alignment of the particles in real space used to generate the 2D class average.
Dear @egelman,
The “rotational alignment” means that the power spectra for each particle image is rotated according to the alignments that were previously computed in the upstream 2D Classification job. The average power spectra thus doesn’t re-compute alignments in the way that you’re describing. The better wording is probably “the particles in each 2D class are padded, PS computed, rotated, and summed together.”
I recall a previous discussion where Ambroise raised the request for the average power spectra job, where the request was that doing averaging of the power spectra of each particle image itself is crucial as opposed to simply computing the average of the already-calculated 2D Class image. Is this related to what you are describing?
Let me know if this clarifies how the Average power spectra script works, or if there are other modifications/updates that would make it behave in a more useful way
Best,
Michael
Dear @mmclean,
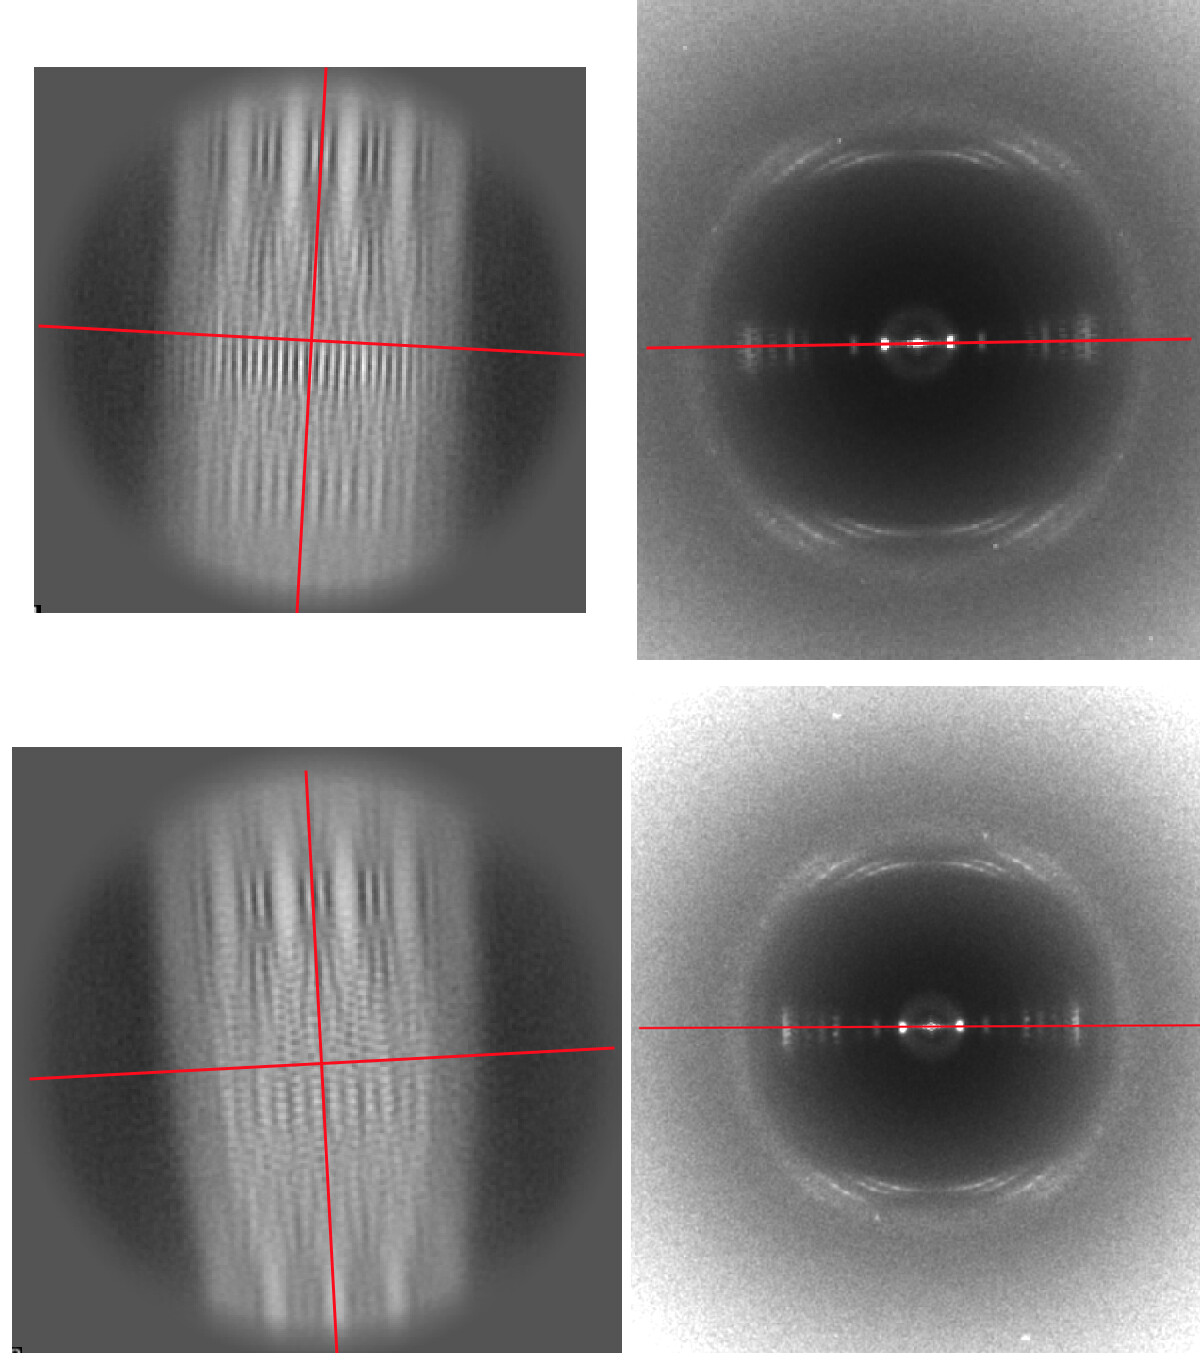
Thanks for the response. First, this has nothing to do with the point previously raised by Ambroise. What I am saying is that the method you describe, where the rotation found in creating the 2D class average is simply applied to each power spectrum, is not what is actually being done. To illustrate this, I show two 2D class averages on the left, and the corresponding averaged power spectrum from this class generated by cryoSPARC on the right. I have drawn in a red line indicating the equator in each power spectrum. I have drawn a vertical red line indicating the orientation of the 2D class averages (which are not quite vertical), and then generated a line perpendicular to that axis. If what you said is true, that the rotation found for each segment in generating the 2D class average is simply applied to the power spectra, then the nearly horizontal line on the left should have the same orientation as the horizonal line on the right. But they do not, showing that some other alignment is being used to generate the averaged power spectra.
I hope that this helps.
Regards,
Ed
Dear Ed,
Thank you, this clarifies the discrepancy, and I can see that the first row of images in particular seem to be out of alignment (tilting in opposite directions). I am having a tough time recreating this issue on our end with a different dataset. Would you be willing to share with us the job report for the job that produced these images? This would include the event log with all of its plots, as well as info about the inputs/parameters, and it would help us figure out an explanation.
Thank you and kind regards,
Michael
I cannot attach a zipped archive. How can I send this?
Ed
You can send a dropbox or other cloud link to the archive, that’s what I usually do
Thanks Oli for the suggestion. Here is the link:
Dear Ed,
From eye it looks like the top left class image is from class 12, comparing them to the event log.
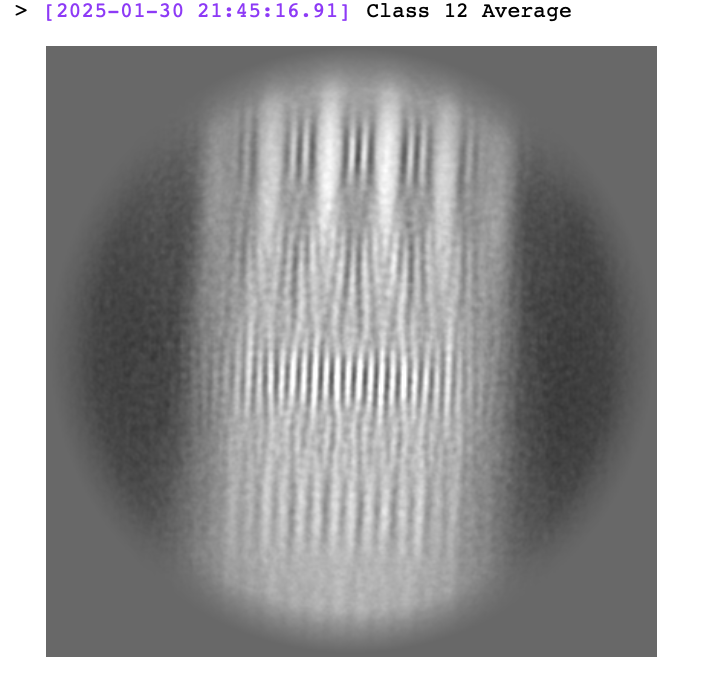
The job showed this image as the averaged power spectrum from class 12 particles:
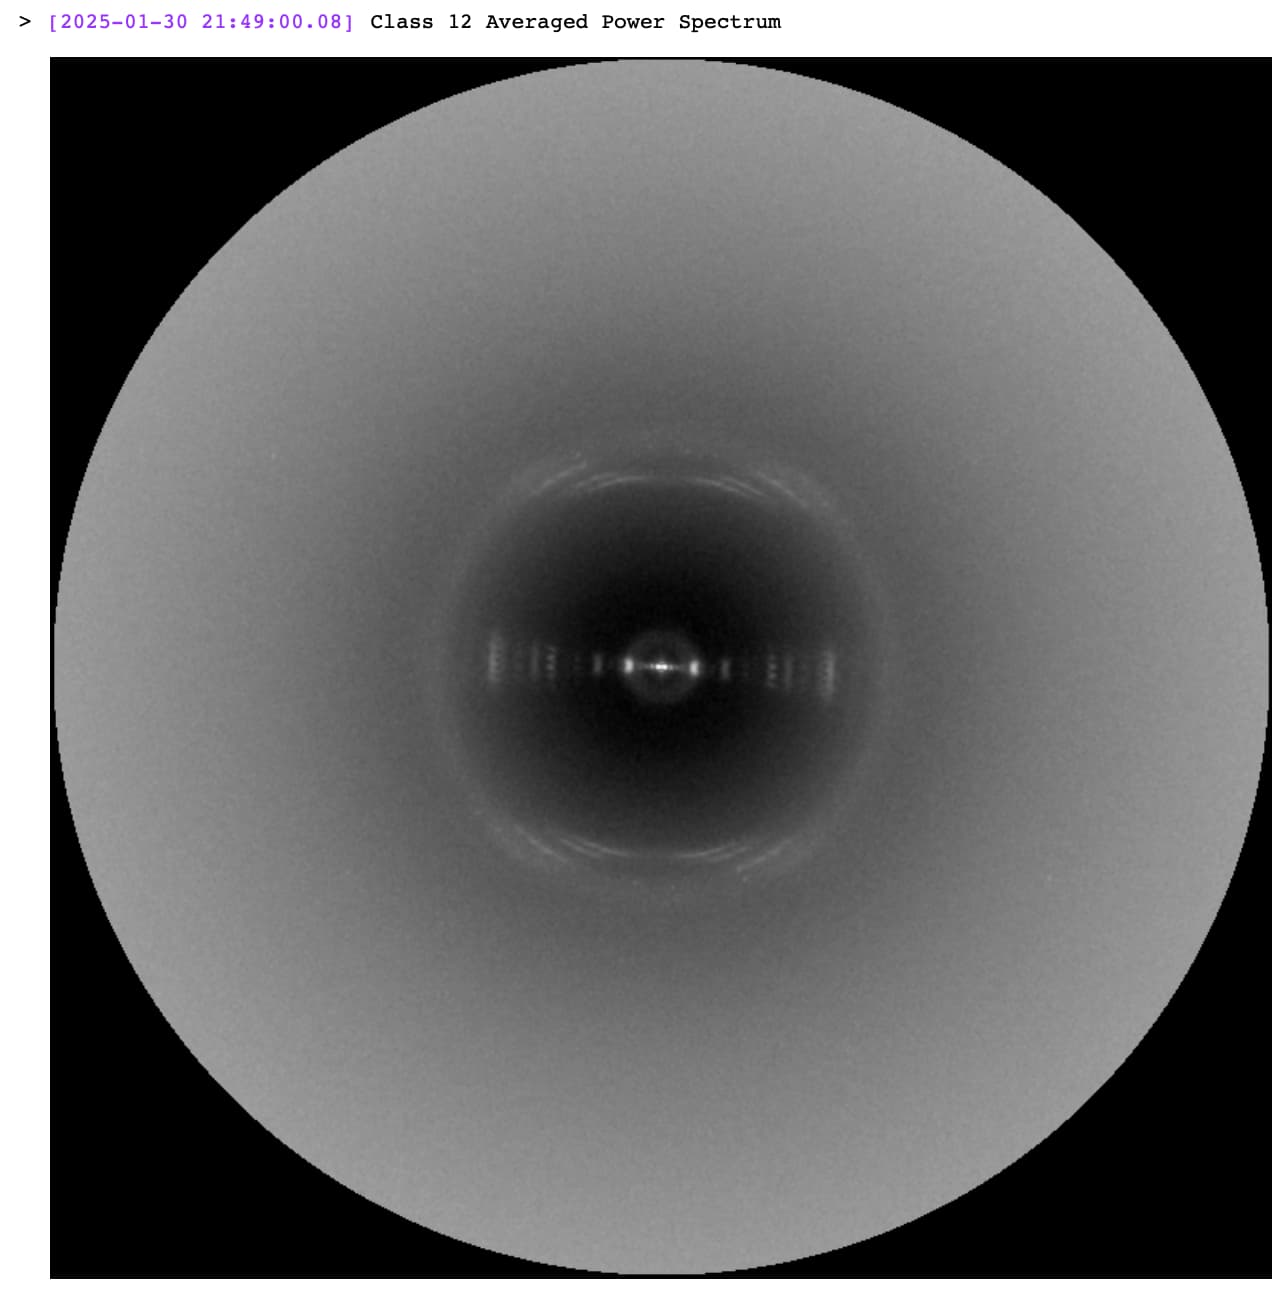
Both appear to have a slight clockwise tilt. Perhaps the spectrum in the top right shown is from a different class (maybe the class before, class 24?)
I believe the bottom left class is class 33, with a slight counterclockwise tilt, whose power spectrum also has a slight counterclockwise tilt from the event log.
These were generated by someone else. We will check if the MRC stacks were screwed up…
Ed
So the stack files are scrambled. This appears to have been raised on other threads.
Regards,
Ed
1 Like
Thanks Ed,
I found the thread referencing this issue. Apologies for this confusing behaviour, we are hoping to make this change in a subsequent release.
Best,
Michael