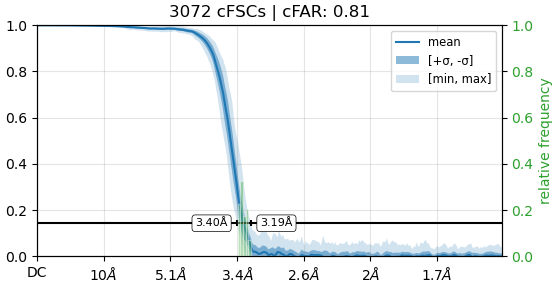
I tried to perform Homo. refinement using around 197K particles with C1 symmetry. The cFAR is shown below. Sometimes I even get cFAR of about 0.89 or even 0.9. The issue is I can’t push the resolution below 3. I don’t know if this curve indicates anything wrong with my refinement. I performed 2D classifications 3 times to filter and clean my particles. let me know if this curve indicates anything wrong with my data set and do you have any tricks that can be used to push the resolution down ? during the data collection we used pixel size of around 0.730. I hope to be able to push the resolution to be lower than 2
cFAR is a measure of the resolution from varying angles around your reconstruction, and how uniform it is. See the guide for more info (and papers). A cFAR of >0.8 is already pretty good (unless you’ve got a high symmetry complex, it’s unusual to get much better).
So that curve indicates there is basically nothing wrong with orientation distribution and map (an)isotropy.
What have you tried? Have you carried out Local CTF refinement (defocus)? Have you carried out Global CTF refinement, and if so, which electro-optical aberrations have you corrected for? Have you carried out Reference-based Motion Correction?
How did you collect the data? Did you use beam image shift acquisition? If so, you will need to split into exposure groups (optics groups in RELION parlance) and carry out Global CTF refinement from there onwards.
Is the sample heterogeneous? If multiple states are present in one refinement, that can be the cause of resolution getting “stuck”, despite having what looks like a nice clean dataset. Try heterogeneous refinement into a few classes…?
Also, if you’ve left a lot of optimisations on the table, chances are <2 Ang is achievable, but remember that sometimes no matter how much you might want, a sample can just get stuck at an unsatisfactory resolution.
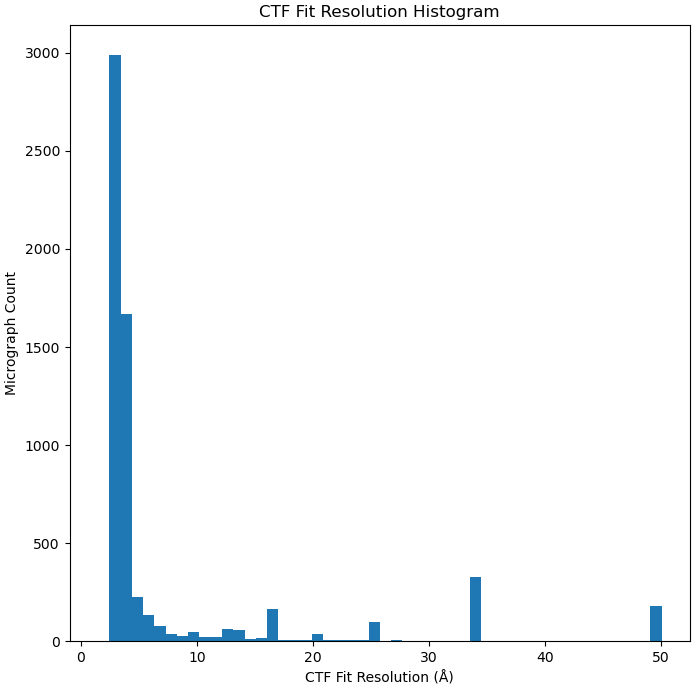
What is the CTF fit resolution for this dataset? I am assuming the cFAR of 0.9 is for a different dataset? This should give you an indication if the problem is with the dataset or your analysis of it.
Regarding heterogeneity, I used both 3D classification and 3DVAR, and I did not observe any major motions or structural variability. I then used the 3D classification results to further clean my particle set and ran multiple cycles of refinement. Initially, I worked from the micrographs provided by the microscope facility. I am now repeating the analysis, starting from the movies, so that I can perform motion-based refinements.
That’s probably quite a lot of your problem right there. By default, neither EPU nor SerialEM carry out motion correction - unless explicitly selected at acquisition time, the single-frame micrographs output by EPU are not motion corrected - it’s computationally expensive for the default microscope PC.
But it remains, what Local/Global CTF refinements did you do (if any)?
Look forward to it.
The CFAR/cFSC plot falls to zero well before hitting Nyquist (which would be ~1.46 Ang).
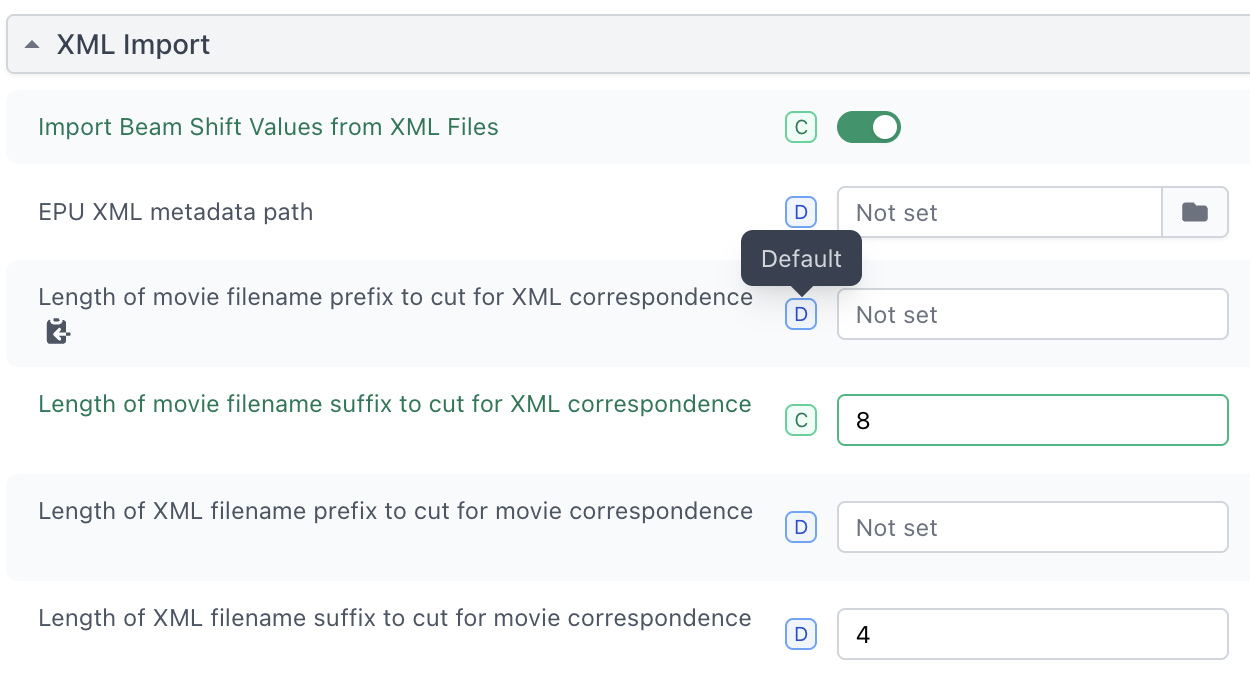
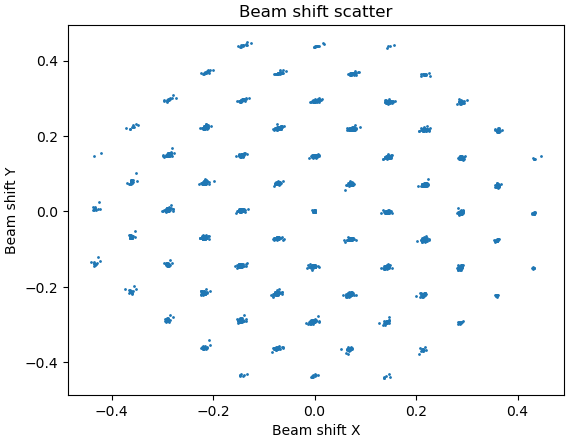
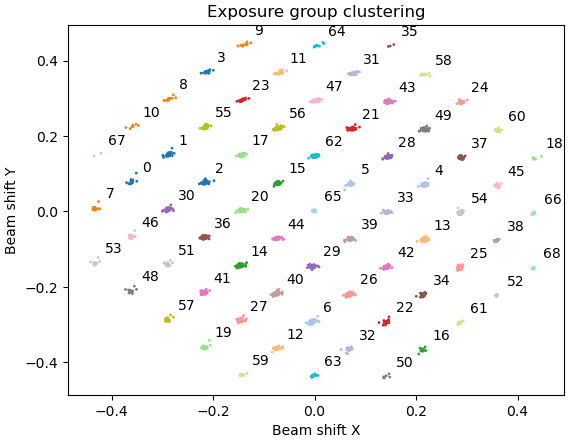
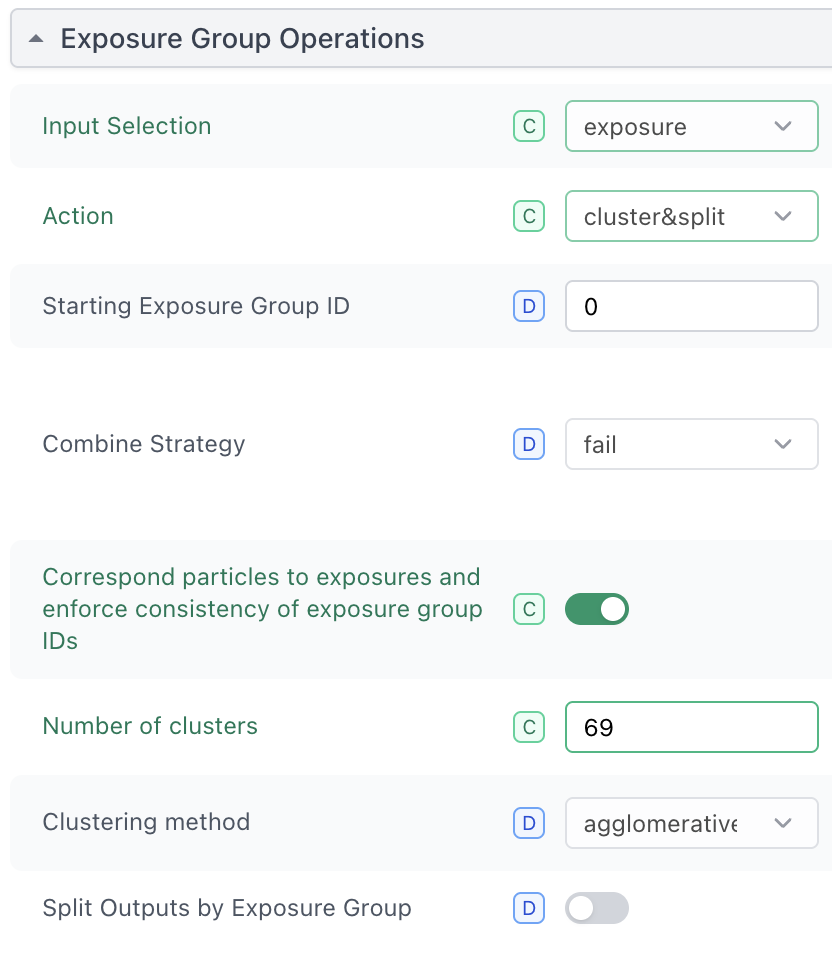
You can then use the Exposure Groups Utilities job. For EPU and default setup on QuantiFoil R1.2/1.3 grids, you’re looking at 69 optics groups (Fig. 3).
I loaded the Movies and and the xml files and it seems that I have zero exposure groups. also when I started from movies I am getting fuzzier 2D classifications compared to the one I was getting when I used the DW.mrc files from the microscope facility.
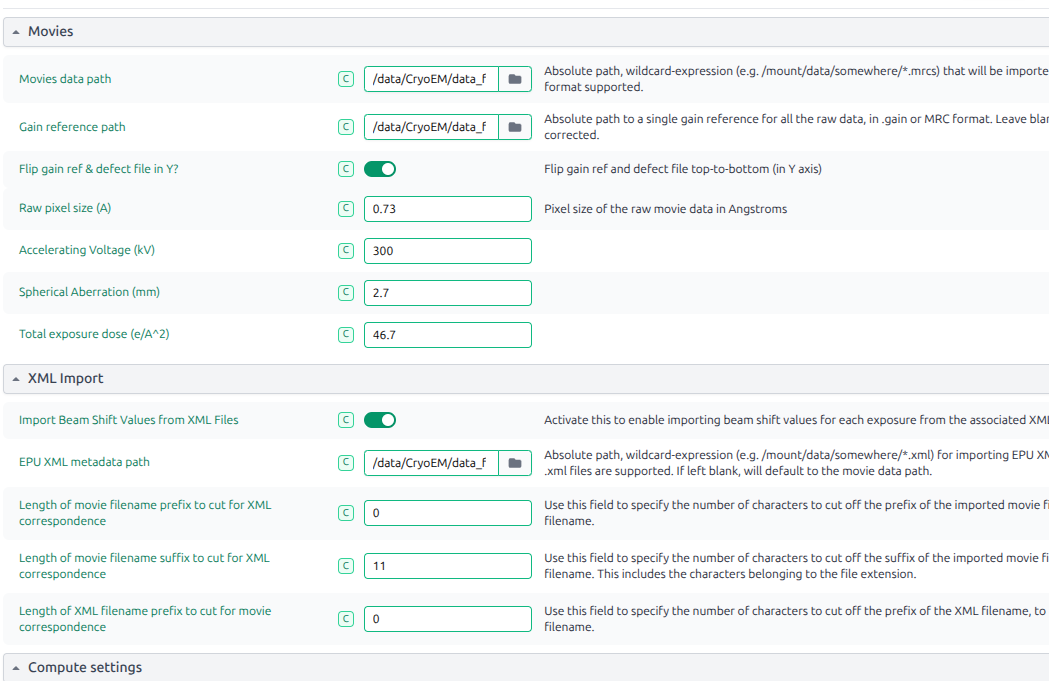
for import movies, what parameter should be change? in what conditions the parameter :Flip gain ref defect file in Y should be ture? and For XML import, what is it, I ‘ve never use these parameter before.
In my workflow, I just use cryosparc-live to import the raw movies, I just set basic parameter of input raw movies.
That definitely isn’t right - not sure what what’s caused that. If anyone else has an idea?
Depends on how your data was collected, and the source of the gain reference. If CryoSPARC Live works for your workflow, why not keep using that? XML import is used for beam shift grouping if data was collected with EPU, to allow better optimisation of CTF parameters.
Our data was collect by EPU, the gain reference was determined from technicist, For cryosparc live, I dont know the differences between live and motion corr or CTF estimation in workspace. I dont know how to judge “works”, the results of cryosparc live seems normal. The using of the live is requested by my tutor, he thinks it saves time and can monitor the process of collecting. I do not know other reson, so I want to know whether other principle and specific reason about it. may about XML file, I have never know about it.
Live is useful to track quality of acquisition, yes.
If gain reference comes from EPU, no need to change anything there.
Exposure grouping by beam shift (if using “Faster” acquisition in EPU) can be very important for optimising your data to achieve the best resolution/quality possible, but at least initially it’s not important - you can import the information later.
Totally, if I dont use a “faster” acquisition in EPU, I do not need to import beam shift file, right? when I learn this technique there is no body mention this point, it a new term for me.
Depending on the microscope (if you have a cold FEG), it can still be useful to split into groups, but that should be done on a timing basis, depending on when FEG flashes took place. If you have a microscope with a cold FEG, ask the facility staff as getting information on flash timings isn’t all that easy.
@F-GST Please can you post the output of the following commands with respect to the movie import job where you observed
csprojectid='P99' # replace with actual project ID
csjobid='J199' # replace with actual ID of relevant import movies job
cryosparcm cli "get_job('$csprojectid', '$csjobid', 'job_type', 'version', 'status',  'params_spec', 'errors_run', 'started_at')"
cryosparcm eventlog $csprojectid $csjobid | grep -A 30 "Importing movies from"