Poor CTF estimation limiting processing on micrographs with gold foil

Hi folks,

We have been noting consistent problems on our Tundra (relatively large field of view) with CTF correction on micrographs where a medium-to-large amount of gold foil is present in the micrograph. I finally sat down and did a (sort of) systematic analysis of the situation (two gold grids with two collections each, where all images were intentionally centered or intentionally off-centered) and I thought I would share since I spent quite a while combing the forums for similar situations (including here and here) and had generally heard that “some” gold in the images was beneficial for processing.

I do not think there is an easy way around this right now processing-wise (although we’d take any suggestions!), but it has been a useful lesson for us that we need to be very careful with image shift calibration, AFIS clustering distance, and potentially for smaller hole grids turning off AFIS entirely with our setup. I’ll note that we have encountered these issues across the board with ultraufoils, au-flats, and hexaufoils, and that because of our Tundra’s limitations the ultra-small hexaufoil hole images will always underestimate grid quality.

Results below (sorry for screenshots of poorly-formatted powerpoint slides, it’s Friday :slightly_smiling_face:). Everything was collected on the Tundra with a Ceta-F at 0.748 A/pix (306x306 nm images).


I also tried CTF estimation using various suggestions on the forum and elsewhere, but to no avail:


Would be interested to hear others’ thoughts on the topic!

5 Likes

One thing I can’t see you have tested with CTFFIND is windowing the micrograph? In RELION it is “Estimate CTF on window size (pix)”. That limits the FFT estimation region to a box of your defined size in the centre, which should allow you to remove the gold (on all except the worst examples) from the fit. I don’t know whether it would help, but it’s something else to try. I’ve rarely found increasing the FFT size to help, except in cases of extremely serious signal aliasing, but “Exhaustive search” with 100-200 step can help sometimes, it just takes absolutely forever to run.

I can’t say I’ve seen the effect be quite so extreme (maybe a Tundra thing…?) but in general I dislike working with gold grids except in circumstances where I have absolutely no other choice (like growing cells directly on grids for lamella, where tomography is a completely different game…).

By and large, I’ve found the advantages of gold foil less than compelling in terms of final resolution: for test samples; 1.22 Å (gold) vs. 1.24 Å (copper), for “real” samples; 1.9 Å (gold, different microscope) vs 1.7 Å (copper, our microscope) or 2.2 Å (gold) vs. 2.3 Å (copper). Basically, they’re usually pretty close in terms of final map. Simultaneously, the overhead in setup is bothersome - particularly when other users forgets to load a copper/carbon grid for alignments.

Cost and availability of supply are the final nails in the coffin for regular use of gold grids for our lab.

1 Like

I will absolutely try the windowing and report back – thank you for that suggestion, that is exactly what we were looking for.

Maybe a Tundra thing also, or a small particle thing needing thinner ice, or both, but we see pretty significant differences in resolution in the medium-resolution range with gold vs. carbon grids (and have some samples that only allow us to use gold grids). All of the examples were at the same scope settings, but some of the gold grids likely had poor CTF estimation with gold in the image, so I should try that again / reprocess (if I haven’t cleared out the data…). We find if we take a lot more data then things can process to around the same resolution, but the data quality is poorer for the carbon grids. Those factors combine to most of my users utilizing gold grids – I agree I try to encourage folks to use carbon unless they need the gold!

IMO it looks like you adjusted minimum resolution in the wrong direction. The hole edge Fourier features are mainly at low resolution, a min res of 20Ă… is usually helpful (you can adjust by eye) in order to mask them. Also, keep in mind that the patch estimates over the ice may be fine, even though the 1D fit and average of the patches used to curate the micrographs is compromised.

CTFFIND4 windowing as suggested is a good idea. You can also adjust the min res in CTFFIND4 to ~20Ă… and maybe decrease the FFT size to boost signal further (default is 512 Fourier px). IIRC Scipion also has a gold masking function that will run CTFFIND only on masked micrographs, you could use that and then extract particles outside cryoSPARC so that they could be imported with CTF estimates.

BTW another factor is scope alignment, as switching through LM to atlas often compromises the alignments made on another grid. Fortunately, recent improvements in SerialEM make it easy run coma-free alignment and objective stigmation “by CTF” over the ice with low dose aligned sums. I’m now able to routinely align over ice on the first try with gold foil grids, even at 200 kV.

Thanks both! I tried implementing two of these suggestions with a good amount of success, results below.

For reference, here are the original CTFs (from CSlive with default parameters) for this data set (different than those above because those above had the gold too close to the center of the micrographs so were not windowable; this was the small hole data set):


Default CTFFIND did do better:


@rbs_sci (1) Relion CTF with windowing: This definitely helped!

  • Estimate CTF on window size (pix): 256
  • This seemed to get rid of most of the gold in the images and was still a multiple of 512; note to anyone else doing this that Relion outputs motion corrected micrographs as 512x512, not your original pixel size, so if you use the outputs of motion correction as inputs for CTFFIND, use 512 as your total length)

@DanielAsarnow (2) CTFFIND with altered parameters, could be done in Relion or CryoSPARC. Looked relatively similar to me as CTFFIND with default parameters. Completely makes sense on why one would want to lower minimum resolution as opposed to raise it; I think I just followed someone else’s suggestion without thinking about it first :slight_smile:

  • Lowered amplitude spectrum to 256 pixels, lowered minimum resolution to 20 A, defocus search step to 100 A.


There wasn’t a super obvious reason to me why some of the micrographs still had an extremely high CTF assigned / much worse power spectra and worse rings in the CTF, although I think you are perhaps correct on the astigmatism having something to do with it (top image below is a “good” micrograph and bottom two are “bad” ones; one seems to have pretty obvious astigmatism to my eye).


(3) A combination of both (in Relion again since CS doesn’t support windowing):

  • Window size 256, amplitude spectrum to 256, minimum resolution 20 A, defocus search step 100 A
  • I thought this looked pretty much identical to option (1), which makes sense because if there is not much gold the other parameters probably don’t need to be changed.
  • I also tried with amplitude spectrum at 128 pixels, but the results were identical to my eye


I took a look at scipion, but couldn’t find anything for masking that wasn’t just cropping borders, so if you can give a point in the right direction, I’ll look again (although as the number of programs needed increase, the willingness of my users to go through a protocol dramatically decreases).

List of feature requests for this issue:

  1. Bumping the request to be able to import micrographs with CTF from a star file
  2. Ability to window CTFs (ideally with an option to set the center of the window not in the center) and/or mask gold edges of the image
2 Likes

Some of the micrographs still had an extremely high CTF assigned

The “CTF resolution” is simply the resolution where correlation between the calculated and empirical radial average PS falls below 0.4, it’s pretty arbitrary. The spikes from the sharp hole edge can sometimes affect the radial average…but maybe the 2D fit or patch fits are OK, like in your 1st example. The other two look like 20 Å is just too high to get a good estimate?

much worse power spectra and worse rings in the CTF

What do you mean? Nothing changes the empirical except background subtraction, although similar there could be a systematic difference in the quality of the subtraction depending on the details of the power spectra.

Have you tried running Patch CTF, rejecting everything that fails badly (e.g. use a 8-10Ă… threshold instead of 4-6Ă…), and then running CTFFIND4 on rejects? Usually this gets most of my micrographs to pass unless they really are bad. You could also try running CTFFIND4 in exhaustive mode instead of using the (equiphase/elliptical) radial average as the initial guess.

Relion outputs motion corrected micrographs as 512x512

You mean the average frame PS? Actually I don’t know what happens if you tell Relion to use the average PS (which you should) as well as a real-space window.

I also don’t think the FFT size should be smaller than 384, there will be CTF aliasing.

1 Like

Glad it helped. Forgot the option wasn’t exposed in CryoSPARC! :sweat_smile:

As @DanielAsarnow says with his comment about CTF fit, the important thing is fit. It’s a pain to go through manually to check how accurate the fit is for each micrograph but you’ll find micrographs with an appalling simulated fit to the actual power spectrum sometimes get through as “good” and other times a good simulated fit will have a poor reported resolution. As long as the first 3 or 4 Thon rings align well, that can be enough for CTF refinement later to clean it up (or the particle gets dumped during 2D anyway…)

Also, the smaller the size of the FFT, the less sampling points you’re giving the fit to work with. Fitting the sinusoidal curve of the CTF with a small number of sampling points makes it much less accurate. The CTF Simulation page makes it really easy to show different FFT sizes and get a feel for how much accuracy you’re losing - and consequently, how many micrographs you may be throwing away…

As for astigmatism, loosen the astigmatism restrictions. This is easier/safer in RELION than in CryoSPARC. I’ve successfully reconstructed 1.9 Angstrom maps from data with ~7000 Angstrom astigmatism - although I wouldn’t recommend it unless extremely patient - the dataset used for analysis was recollected, my processing of the extreme astigmatism sample was just out of curiosity… got to the same resolution when fits were correct, it just required dozens of hours of CTFFIND in extensive mode to get good 3D.

This is a good idea to try as well - for some datasets (giant viruses) my CTF cutoff criterion is significantly more relaxed than for a high-quality apoferritin grid. :wink:

Agreed, aliasing is often still evident at 512 FFT as well.

Thank you both for all of your insightful comments and the time spent on them!

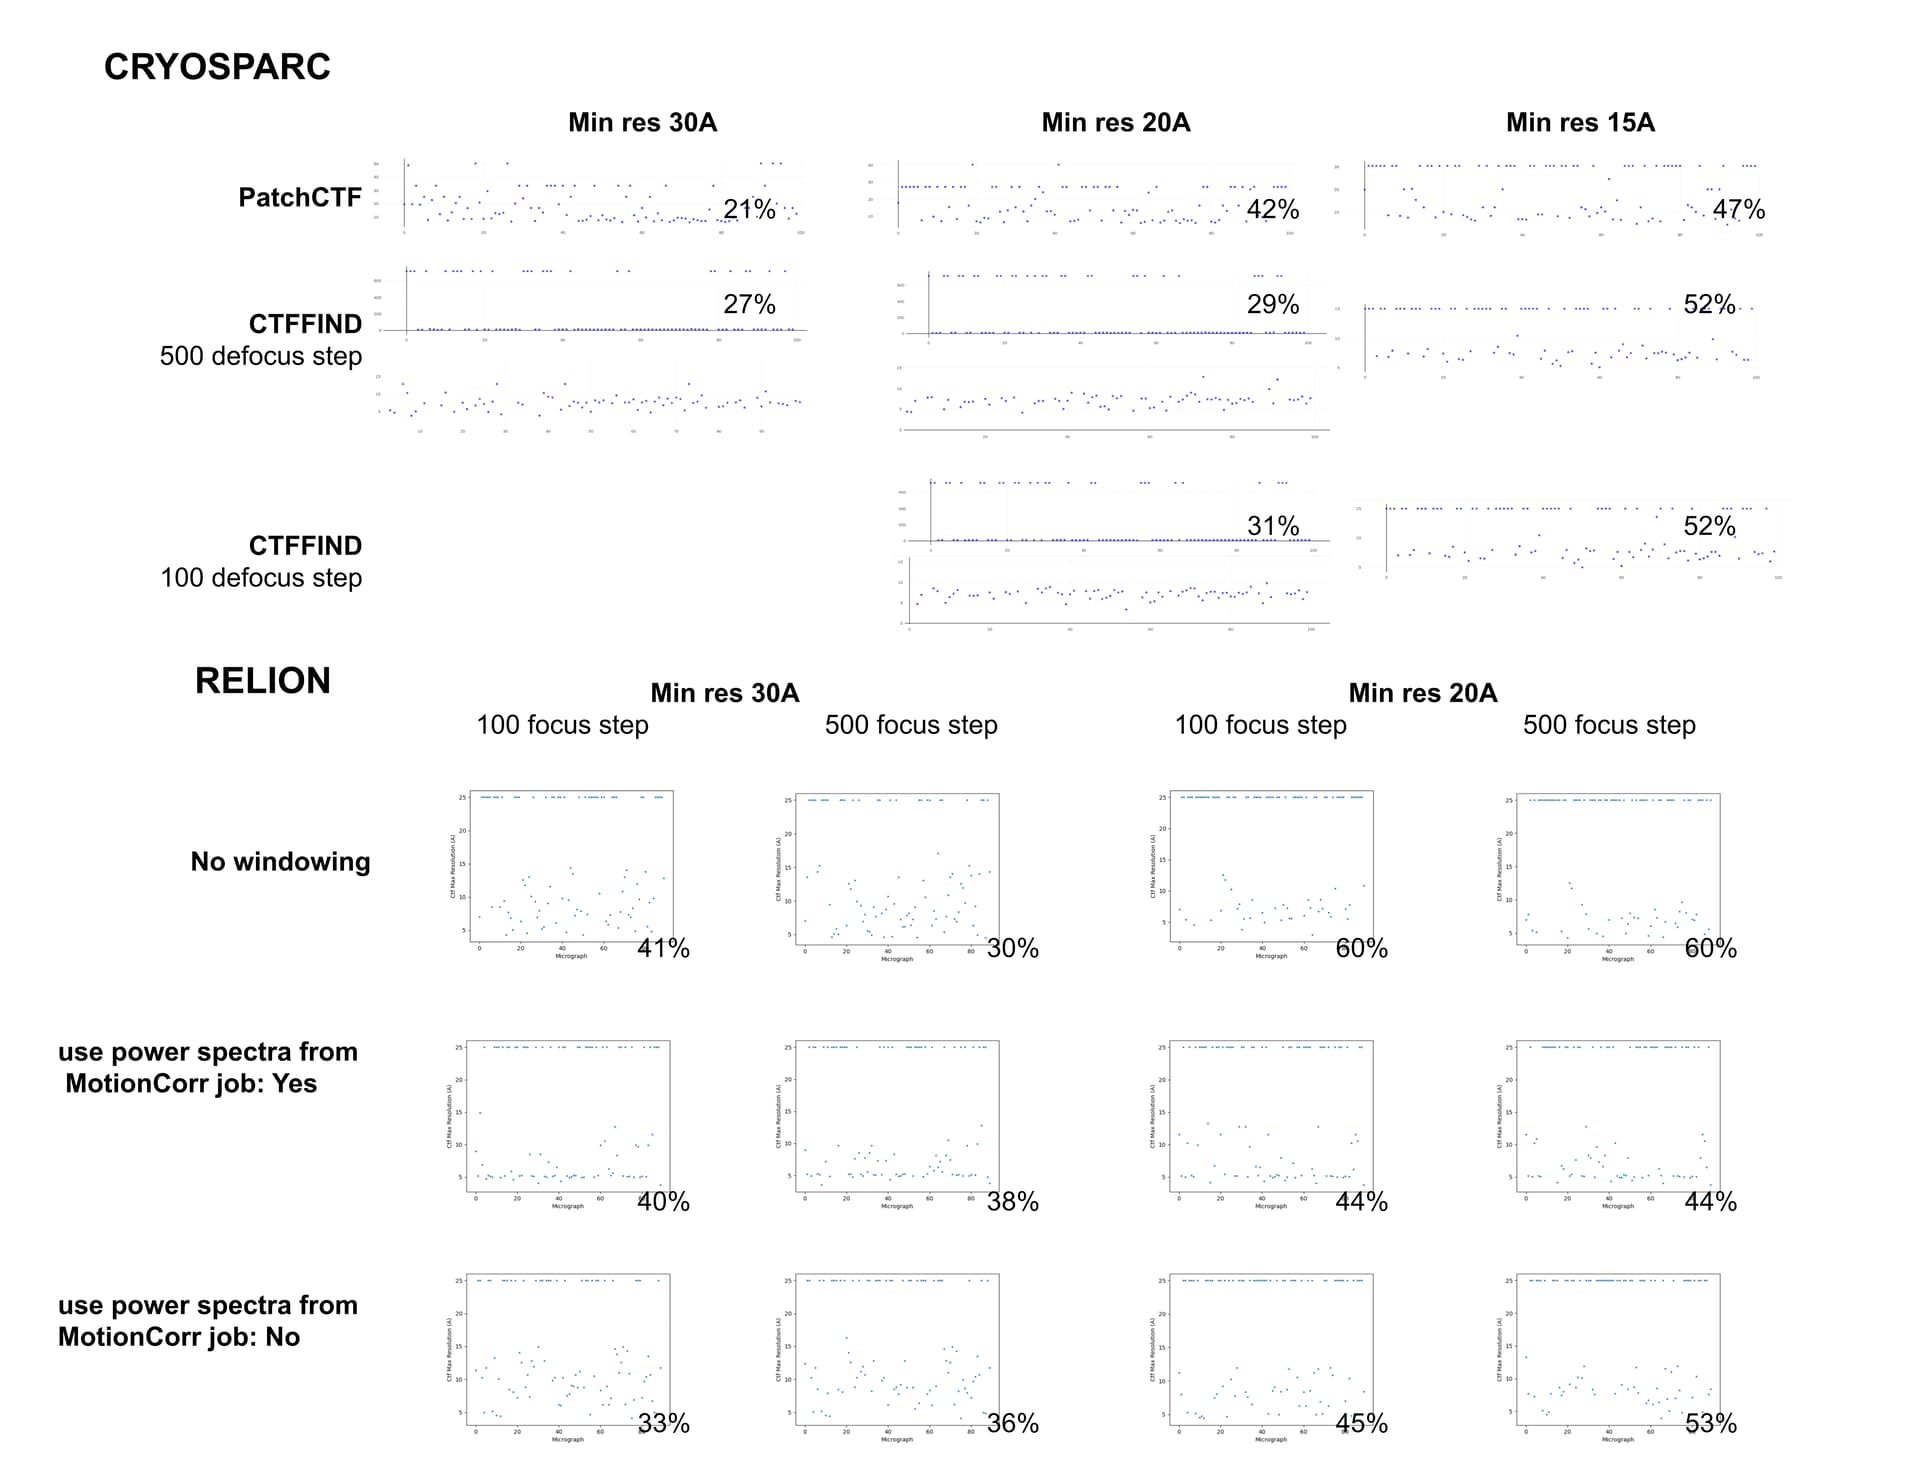
@DanielAsarnow I see what you are saying re: 20A still being too high in those cases, thanks for making that clearer for me. I tried running Patch CTF, rejecting everything that fails badly (honestly we often have our limit around 10-12A anyways), and then running CTFFIND4 on the rest – it saved about half of my micrographs that were rejected. These results are already running in exhaustive mode, except for the defaults run.

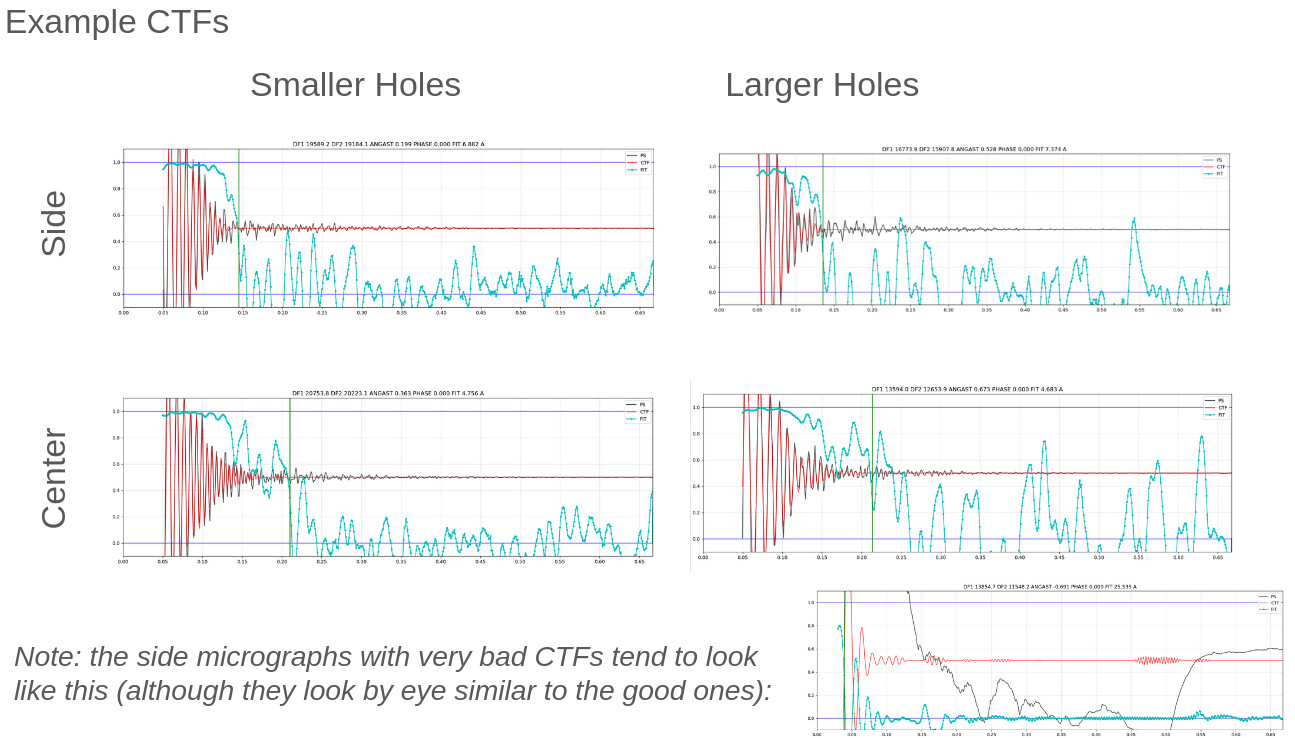
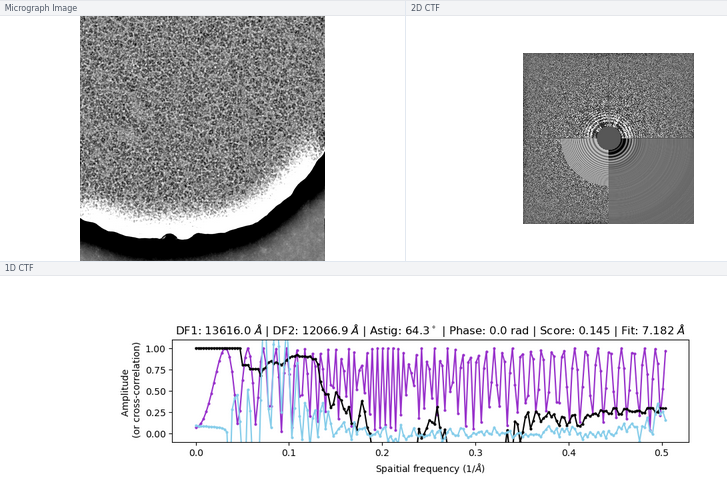
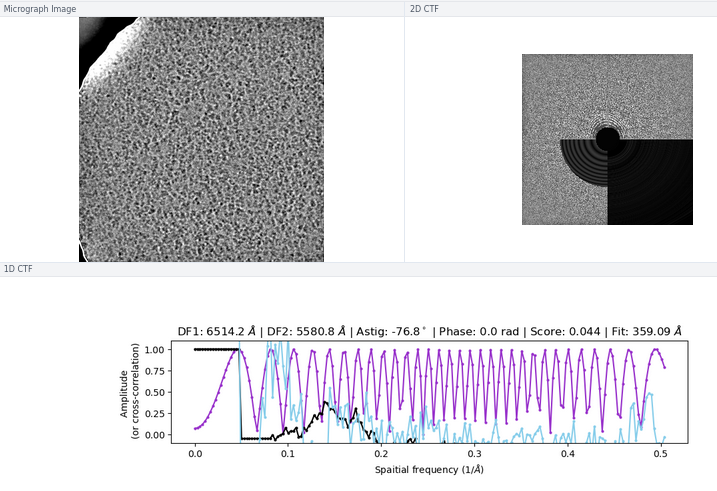
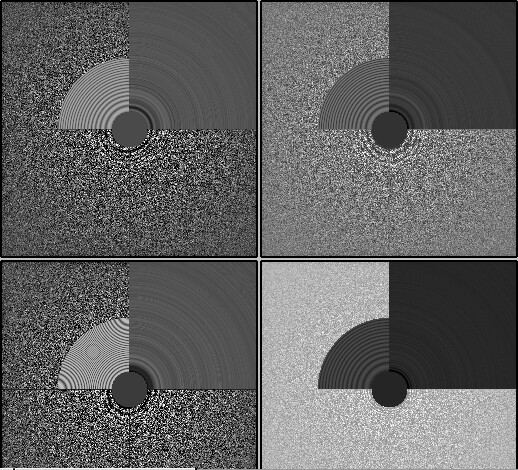
My comment around the empirical FFT was that the Thon rings appear much clearer in the top example than in the other two to me by eye (and in the radial average). Makes sense that it could be a function of the background and/or where the cutoff is. I suppose the amount of work that should go in to saving some of these micrographs is dependent on how painful it is to generate more images and what fraction can be discarded, but it seems at least that windowing / masking out gold definitely turns some of these data sets from unuseable to mostly useable.

@rbs_sci Thank you for the input on loosening astigmatism parameters if needed – I do think any astigmatism problems we are experiencing are pretty secondary to the CTF issues. We’ll keep it in mind should more primary astigmatism issues arise.

I have tried doing CTF refinement before on some of the particles from “bad” data sets, but I think the original fit was poor enough that it wasn’t saveable, so the lowest resolution few peaks fitting is good to keep in mind. Also, I’m a huge fan of the CTF Simulator, so thanks for posting and I will take a look in this particular case re: FFT size.

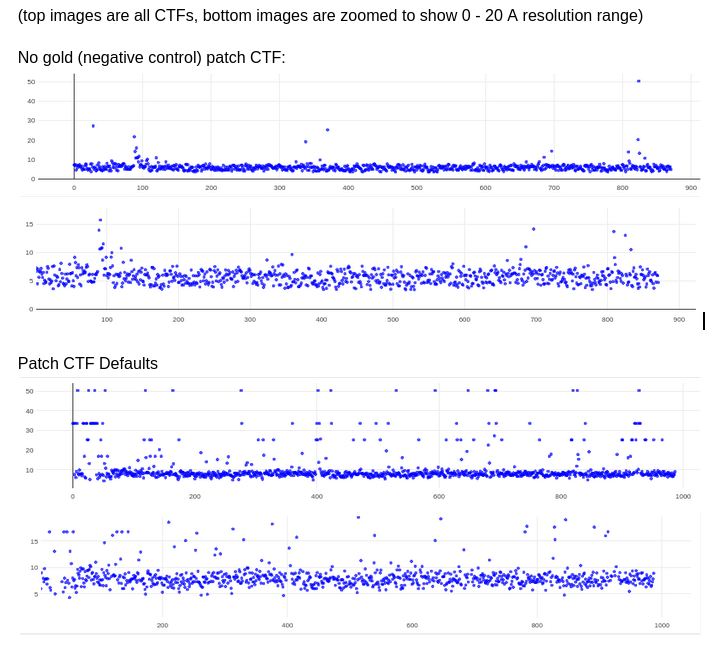
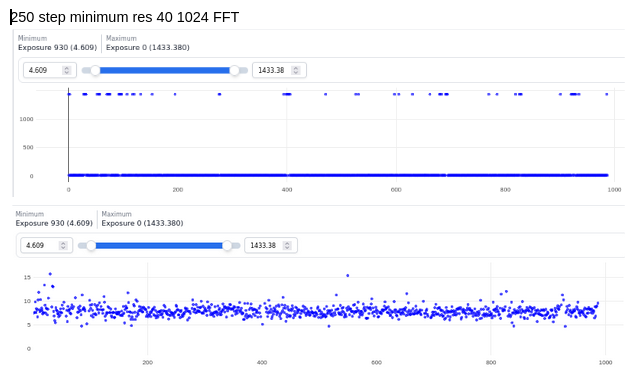
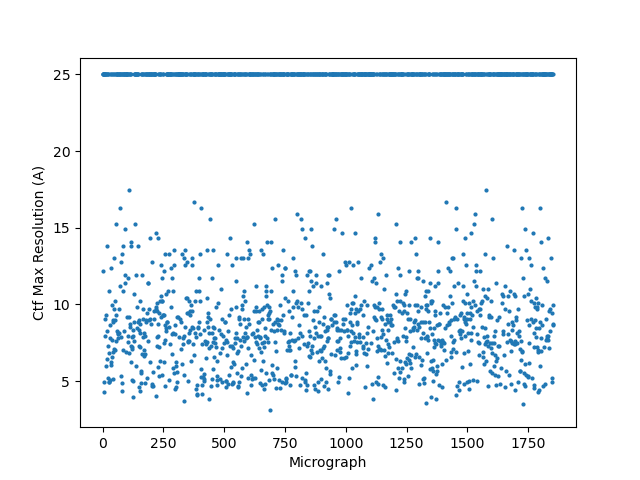
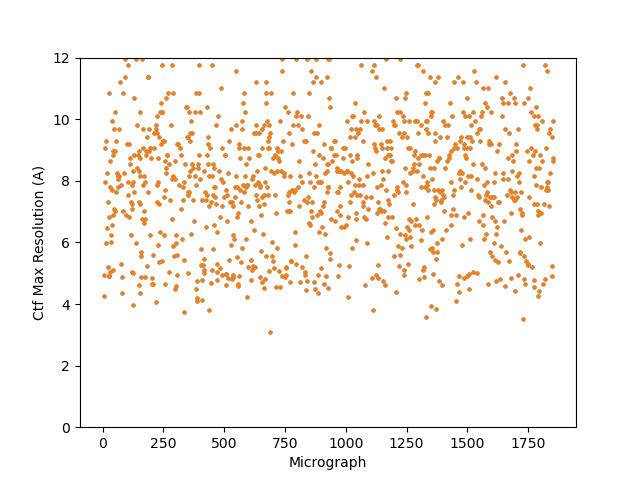
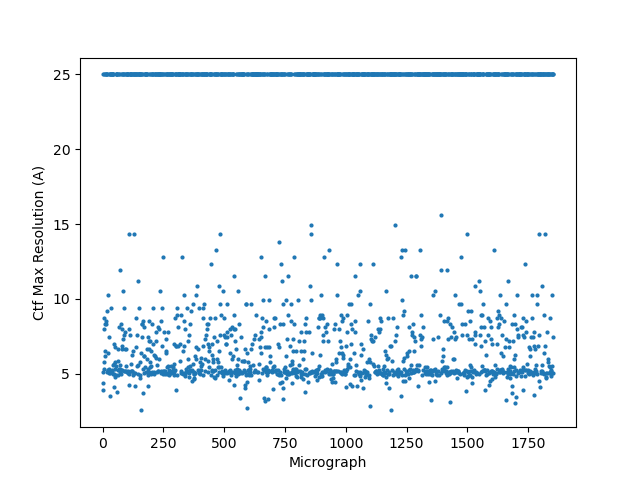
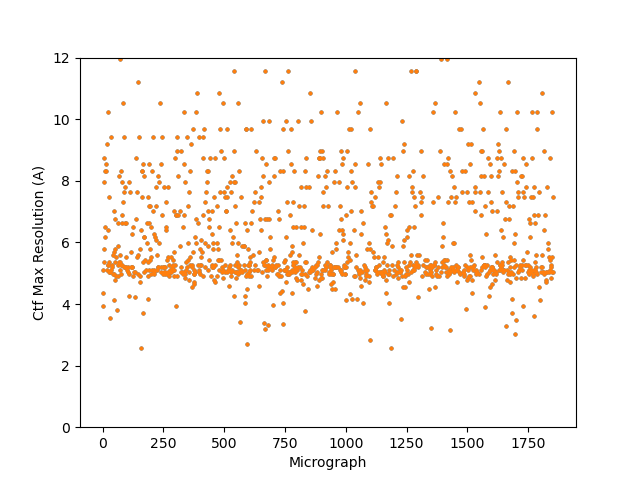
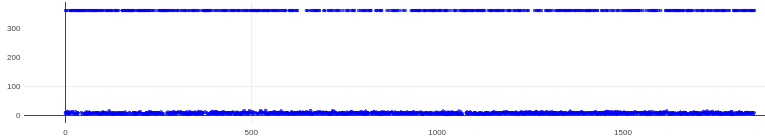
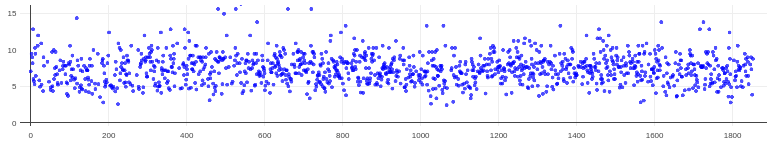
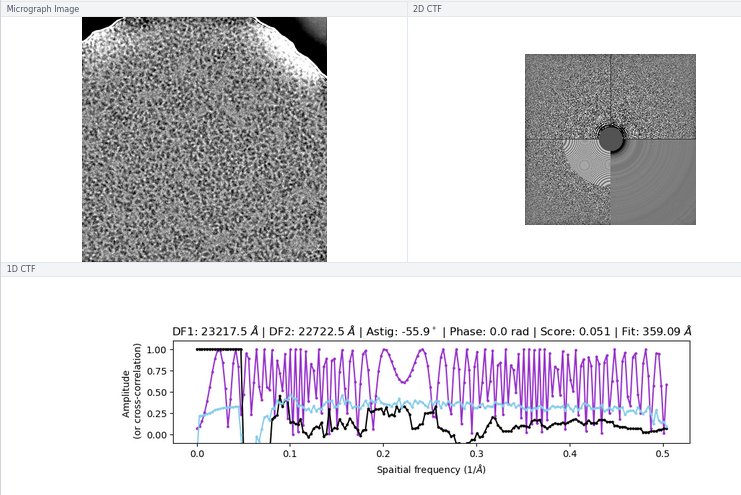
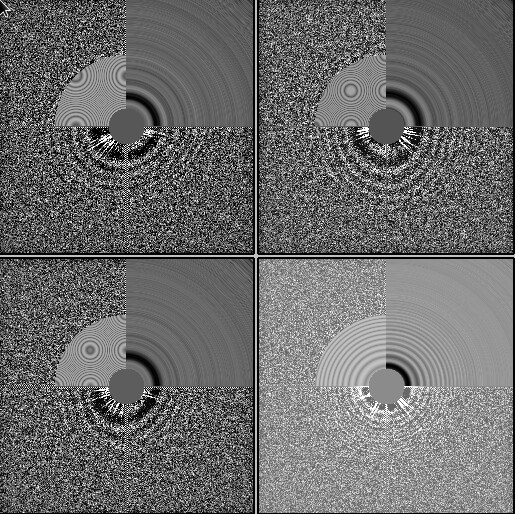
On the Relion windowing size issue: Good catch @DanielAsarnow, I did mean average frame PS. Dumping in the micrographs from a default MotionCorr job (which are still 4096x4096) and then specifying “yes” to “use power spectra from motioncorr job” requires that you specify the window on the scale of 512x512. Otherwise you will get empirical data that look like QR codes :sweat_smile: (the scale also becomes very off; below the “yes” images are shown at a scale of 0.1 and the “no” images are shown at a scale of 1). If you say “no” then you can use the full size, i.e. 2048, and the outputs look reasonable. I’m a little hazy on where windowing comes in post-PS calculation, but using the motioncorr PS vs not seemed to “save” slightly fewer micrographs but overall give lower average estimated CTFs (see below; I guess it is a trade off between more data and the gold reflections but still not sure where windowing comes in if the PS are already calculated?).

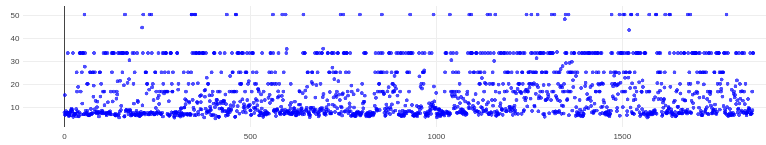
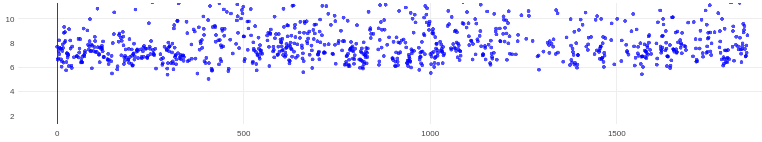
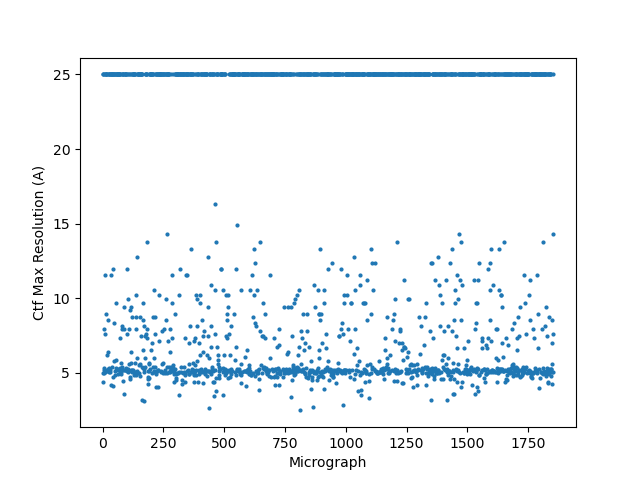
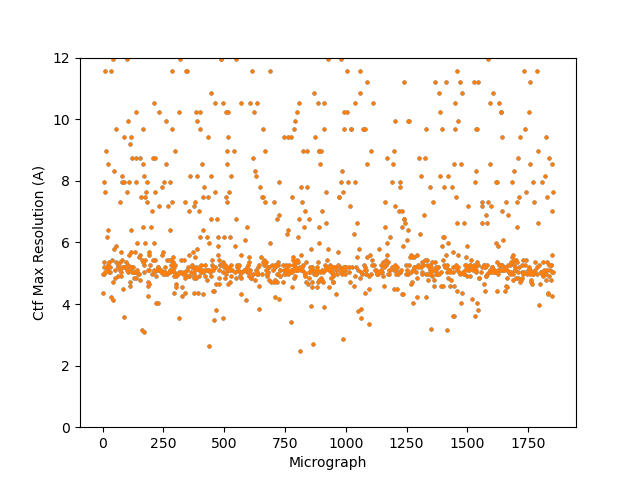
Hopefully anyone interested (I can’t resist an opportunity for a good side-by-side comparison) can zoom in on this image – the percentages are the percent of micrographs that were assigned an extremely high CTF max res (generally >30A but otherwise the upper ceiling).

Probably the take away here is there isn’t one “fix” (except maybe gold masking??) and the best thing is, as @DanielAsarnow suggested, to process different micrographs in different ways depending on how the results of the initial rounds of patchctf and CTFFIND look. For us the windowing does seem to mostly rescue much of the data set to where it would be expected if there were no gold in the image, so if anyone gets stuck here in the future, that’s where I would start, but we’ll be trying to avoid much gold in the image if at all possible.

All good suggestions and I appreciate the discourse – hoping that as CryoSPARC continues to advance there will be the option to process these sorts of difficult micrographs using windowing/masking within the interface!