Dear all,
I run a patch CTF job on my micrographs and tried to curate the exposures in order to leave only the best micrographs. The plots show a lot of images that have too thick ice, astigmatism, bad CTF fit etc. Using the threshold I can nicely accept only the best ones.
However, when I manually inspect the micrographs, I see that especially the CTF fit is all over the place, showing a good fit for micrographs where the CTF is barely visible and also doesnt match at all to the fit and vice versa. I see that sometimes grid edges are visible, which could throw the CTF estiamtion off.
Which setting would you suggest for a better CTf estimation?
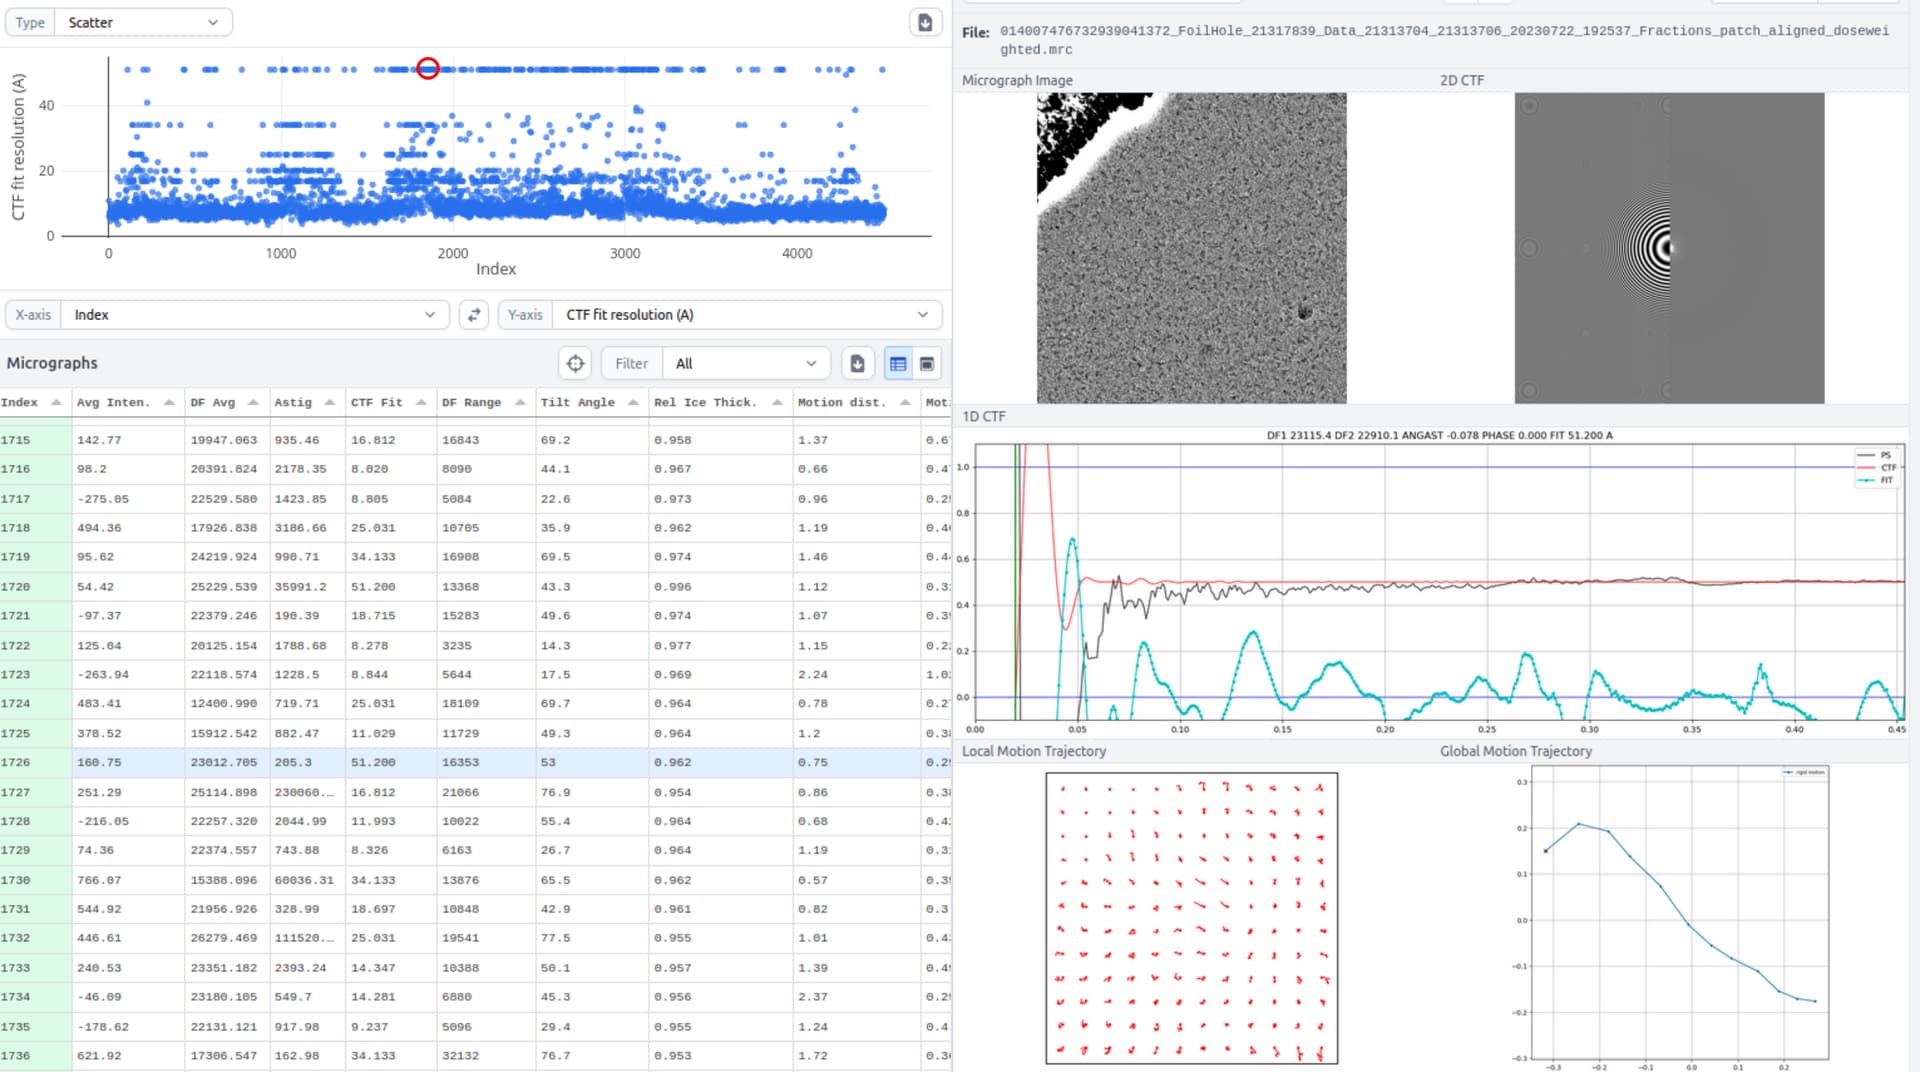
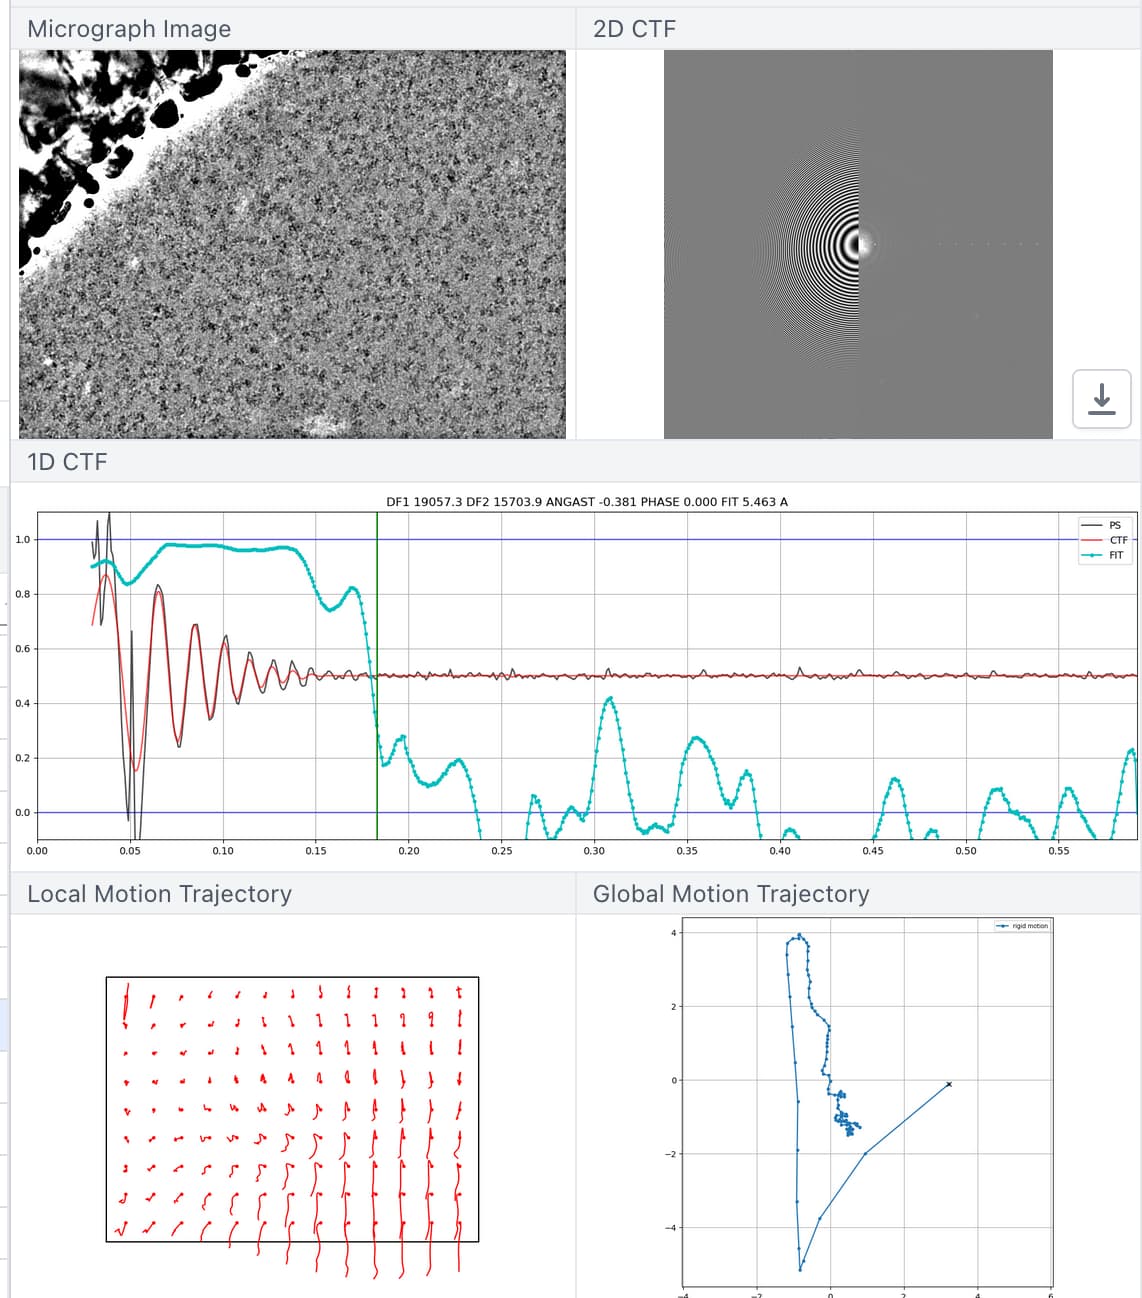
Micrograph looks fine for me, CTF fit is super bad
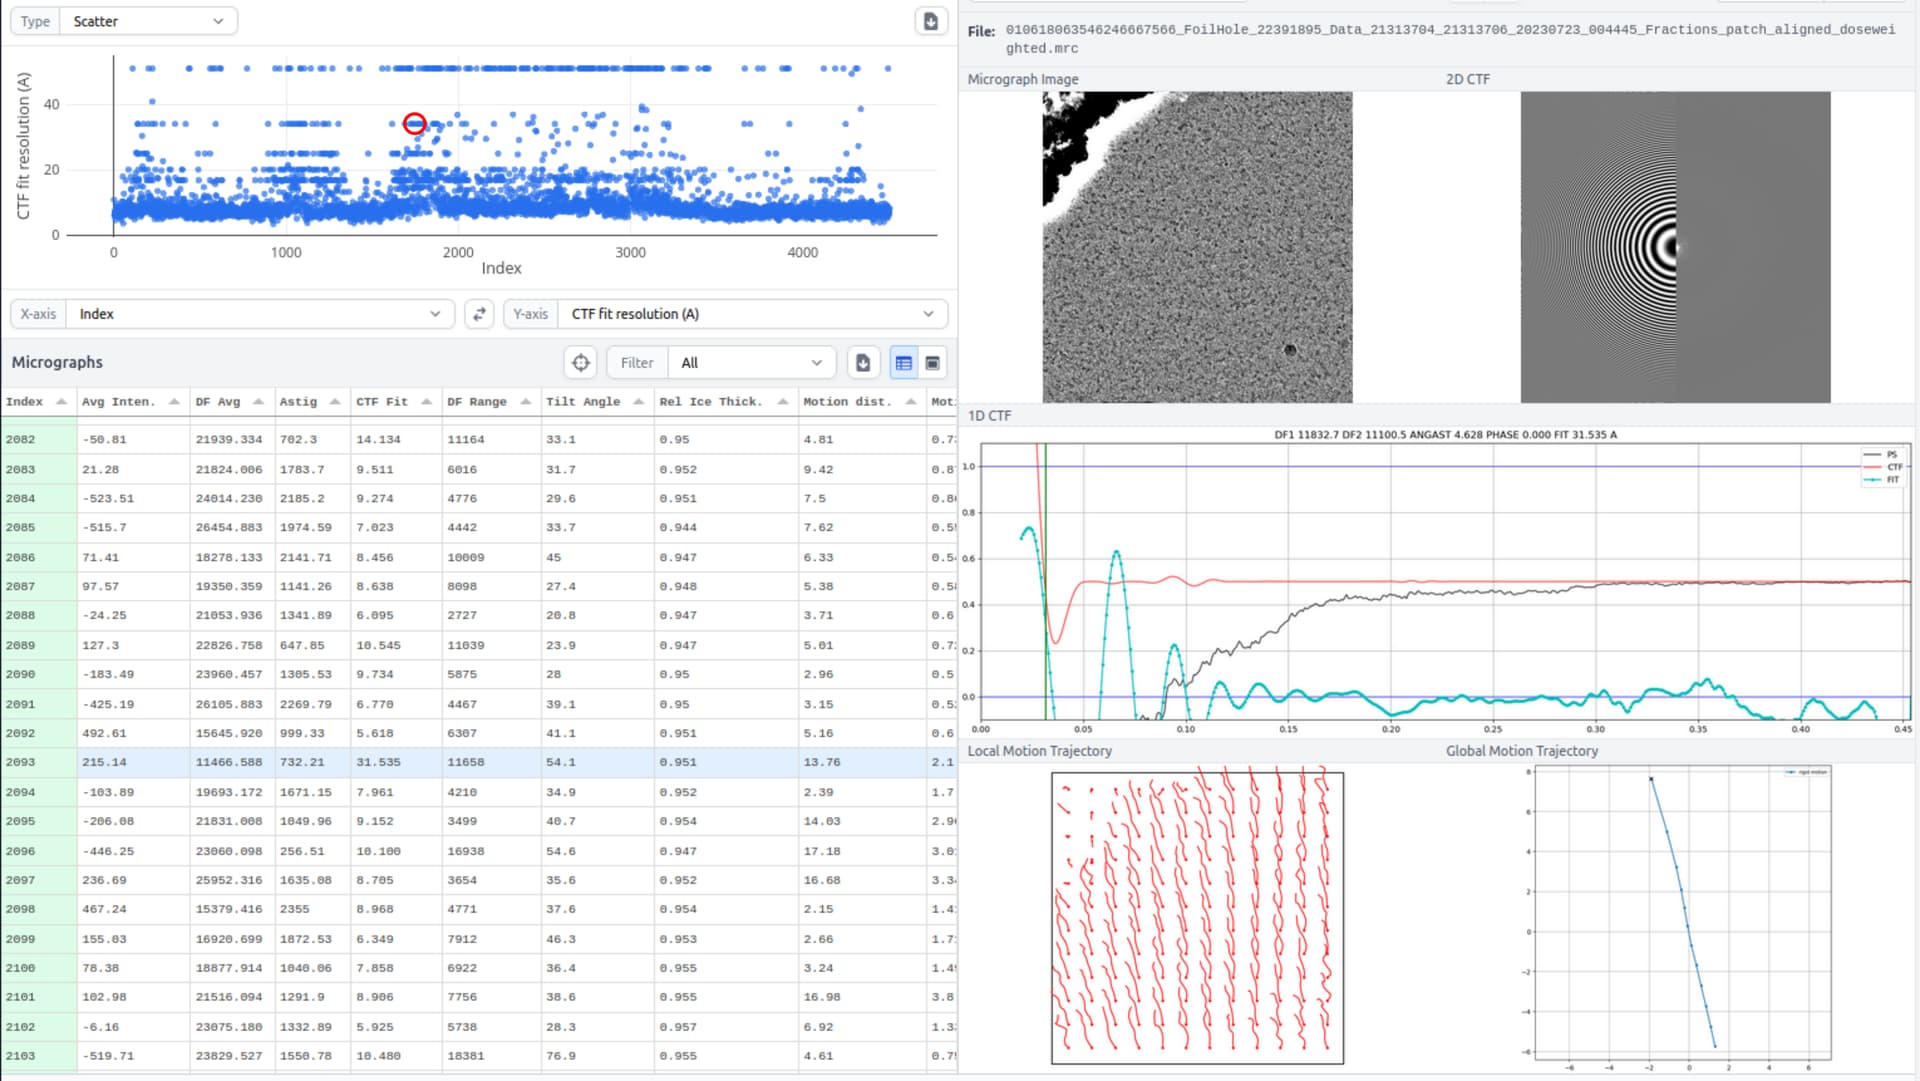
The first two probably have poor defocus estimation because of the clipping of the gold edge. Looking at the Thon rings in the aligned image, it’s unsurprising that the CTF fits are poor because there’s no Thon rings. Similarly, the radial average of the Thon rings (power spectrum, black line in the fits) is quite poor and shows no real oscillation. Perhaps that’s because it’s dominated by the amplitude contrast of the gold - that’s a guess, but you can see that the power spectrum has high contrast but no oscillations (so it’s probably not phase contrast?).
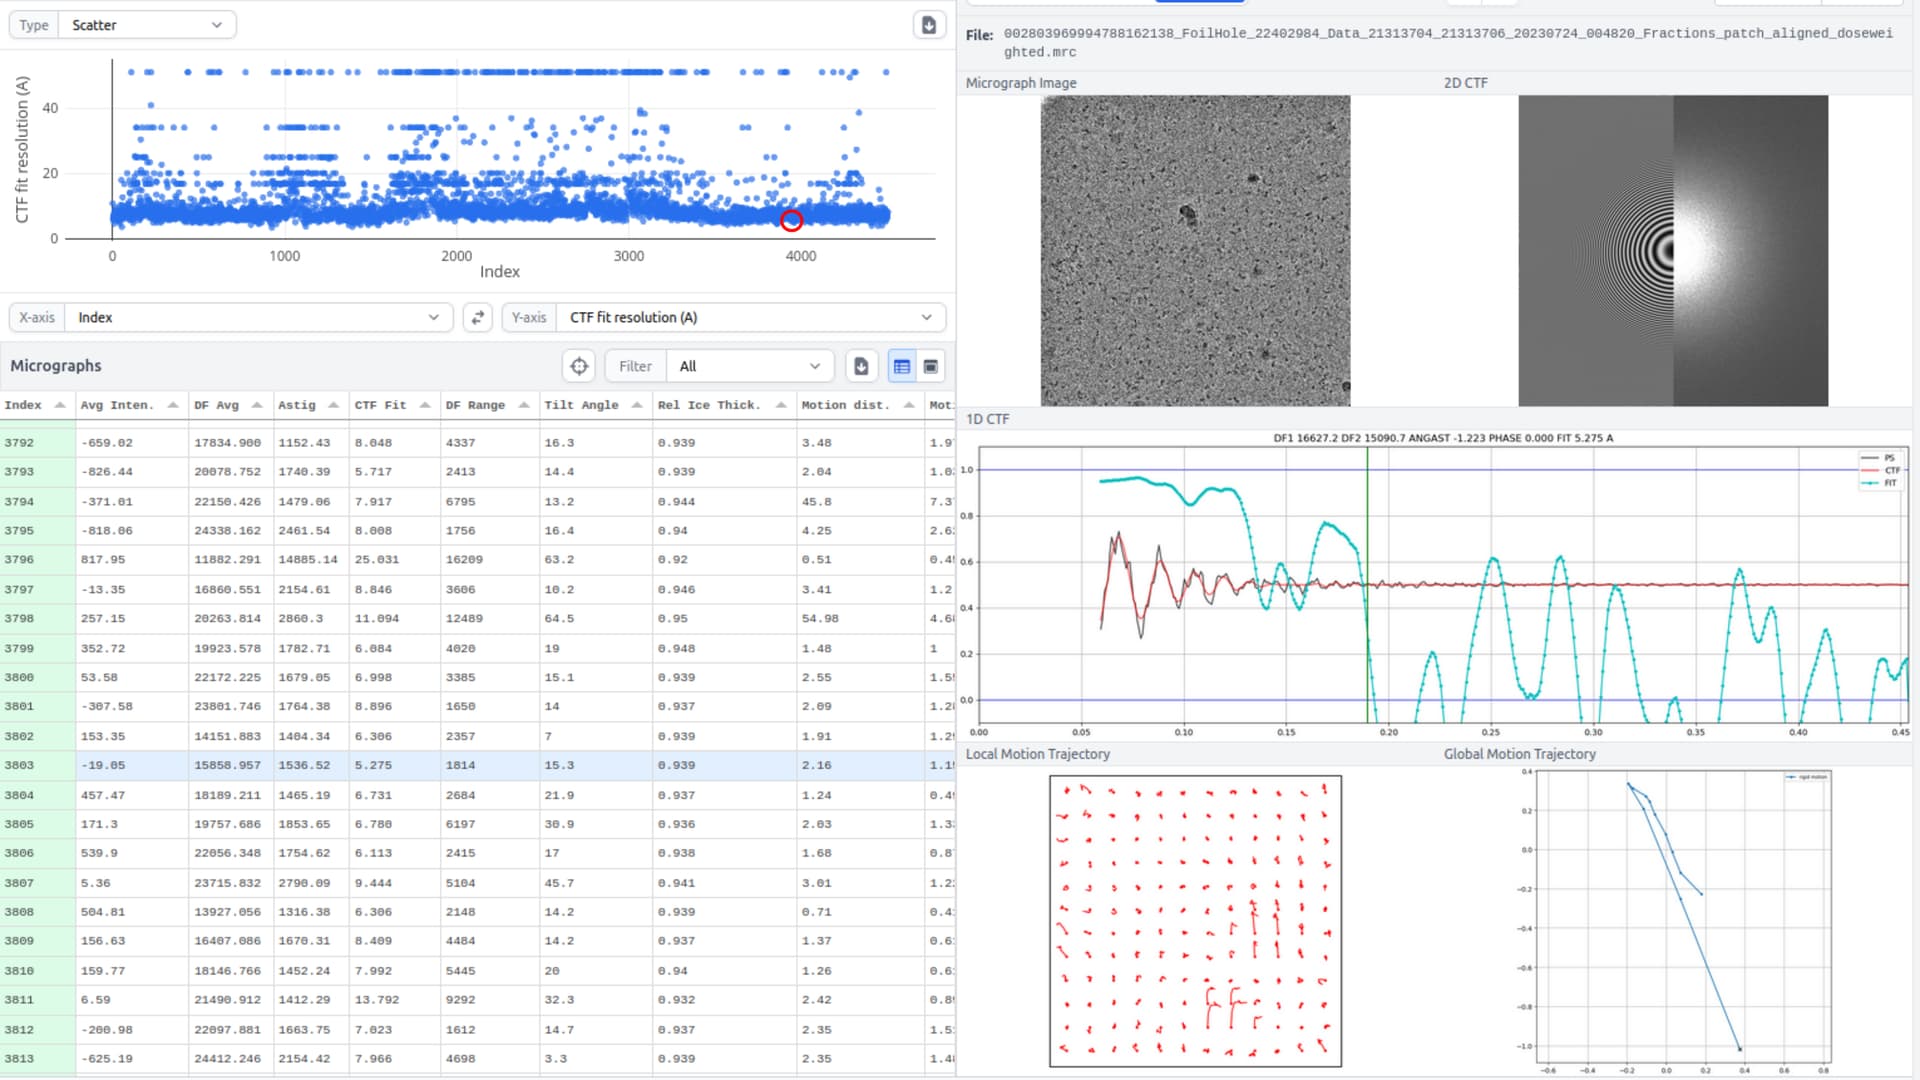
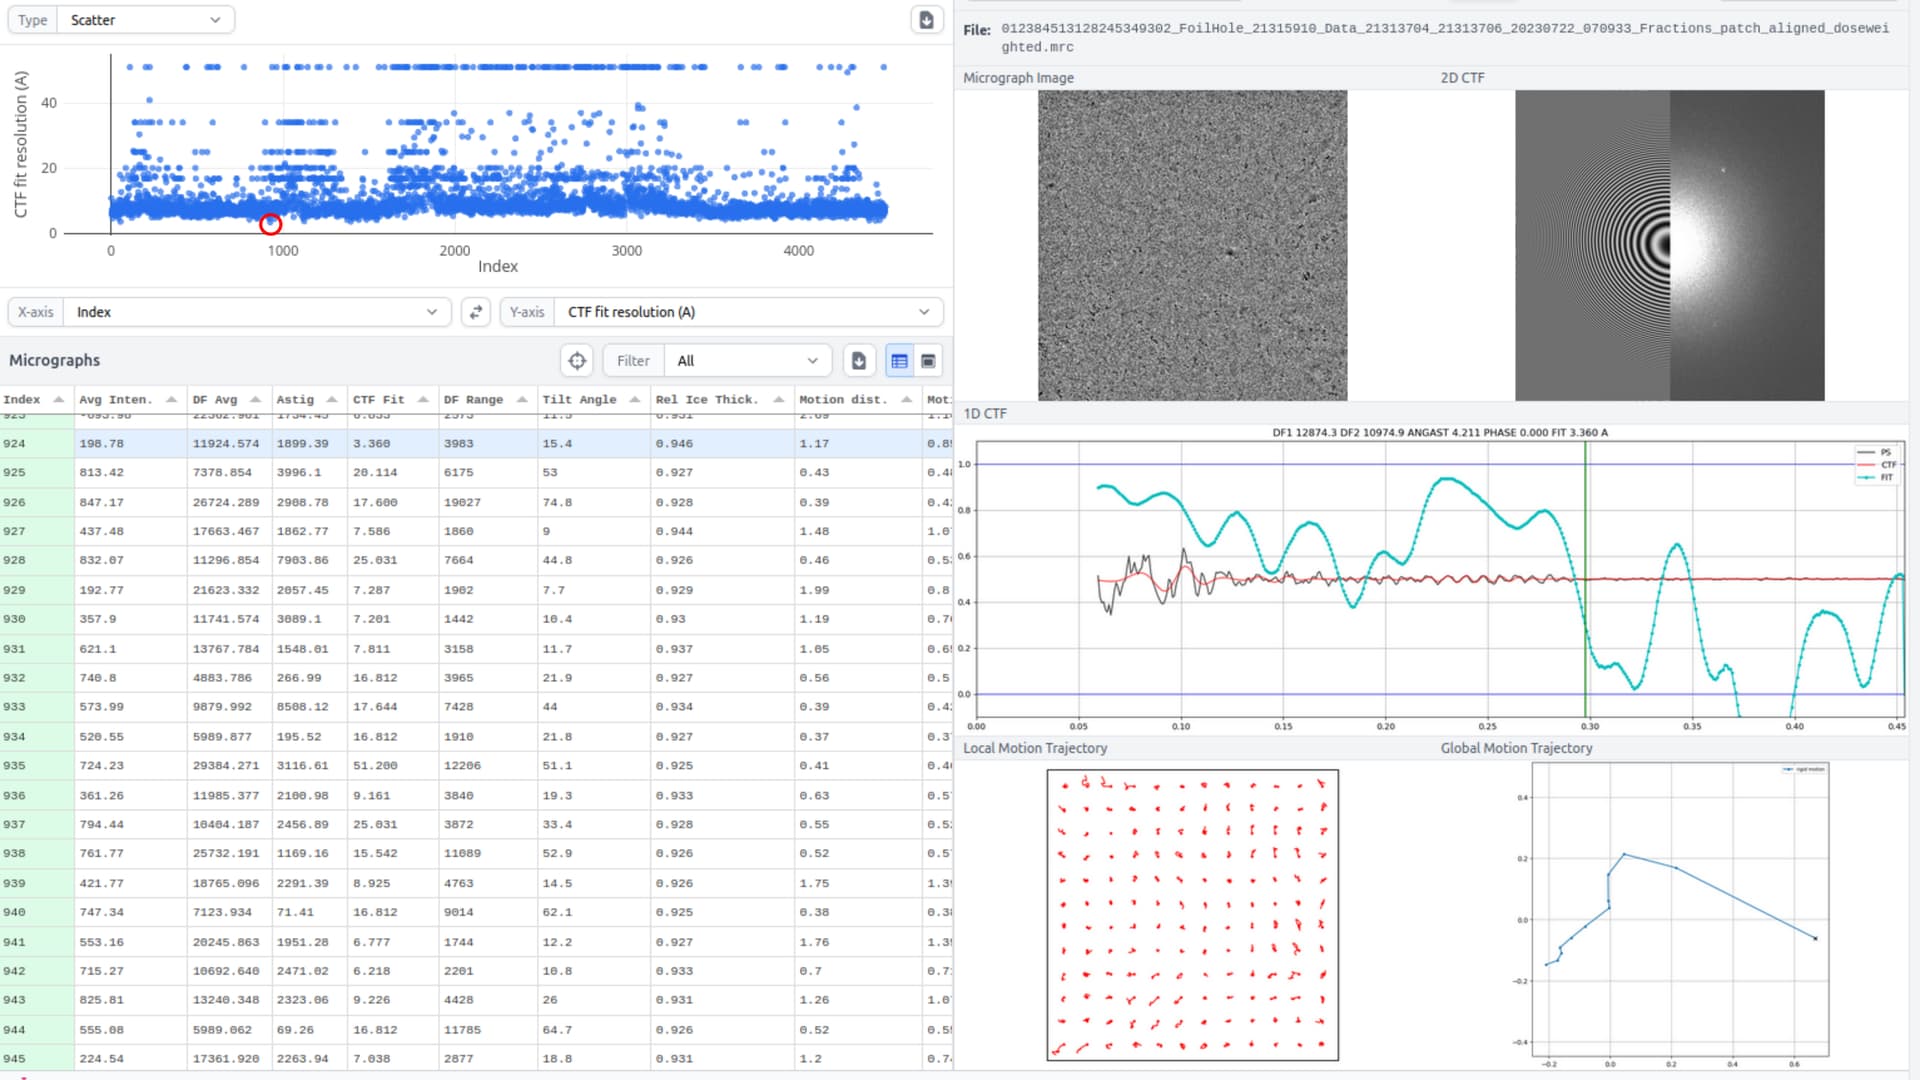
For the other two, I think I see rings in the CTF, but the scaling isn’t great and either your browser, or the image itself, seems to be mis-scaled. However, if you look at the radial average, it’s really quite a poor fit - sure, it drops down below 0.3 at the nominal resolution, but it looks like fit is quite bad, especially at low frequency. Not entirely sure why, there, unfortunately, hopefully someone else will have ideas.
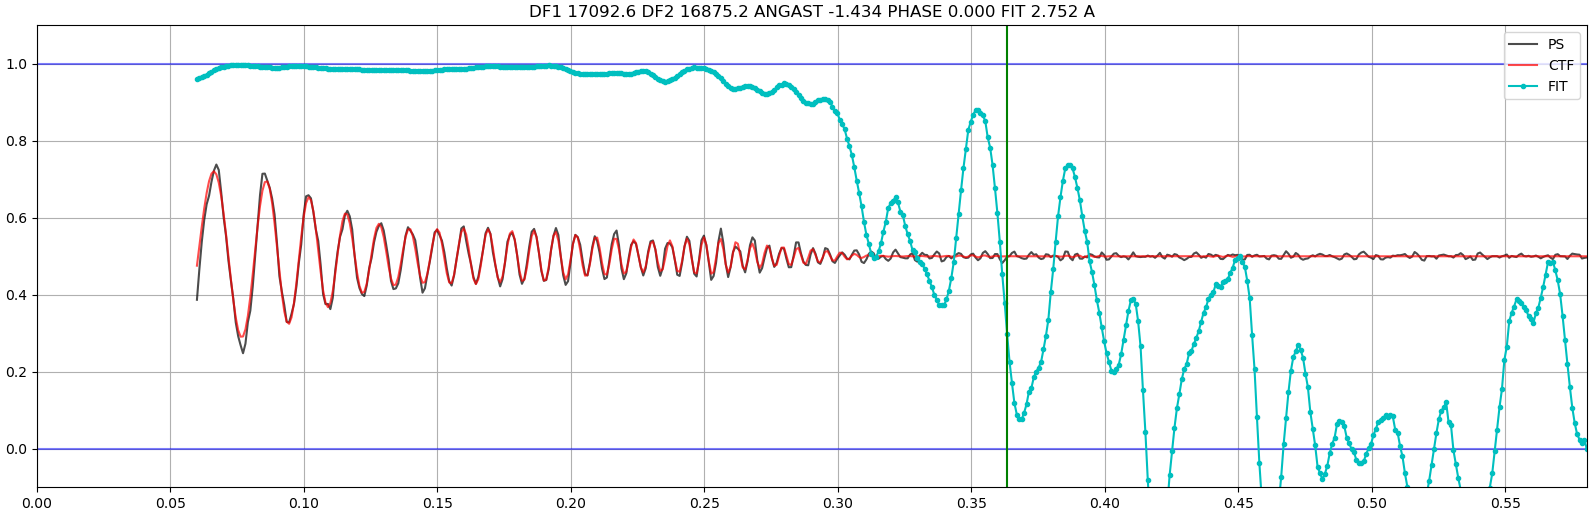
I agree with @ccgauvin94’s diagnosis — for comparison, here is a radial average with a better power spectrum. We can have a lot more confidence in this CTF alignment because there’s “more information” to compare between the fitted CTF (red) and the image’s power spectrum (black).
Your PS line (black) has a much lower magnitude because this is actually the background-subtracted power spectrum. Background in the PS can come from a variety of sources such as inelastic scattering and optical effects. The important thing is, we look for the rings after subtracting away this background. So if there is a high background, there’s not much left to see after subtraction, leading to the poor fits you unfortunately observe here.
If you’re interested in more discussion of how CTF fitting works in general (not specifically in cryoSPARC), the CTFFIND3 and 4 papers both provide practical discussions of the topic.
for the latter two, I think defocus is again mis-estimated as they seem significantly more defocused than 1-1.5. empirically defocus only seems accurately assigned up to ~2.5µm, and I would guess your “decent image but bad CTF” micrographs are visibly at the higher defocus range. Collect closer to focus, or tighten the range so multi-shot do not stray into high defocus. Also, your baseline of fits seems high ~5Å. with well-aligned scope you should get <3Å CTF. Consider ways to increase particle concentration in grid (start with higher concentration of sample) to increase contrast vs noise at low defocus, and test setup with standard sample to make sure the microscope achieves 2.5Å for test samples.
The contrast is maybe thrown off by a speckle in CTF - from graphene or carbon (6 speckles to be more accurate)? Also when possible collect over uninterrupted vitreous ice.
While doing this somewhat escapes the point of “patch” CTF estimation, test with a single (1x1) patch. Also test using CTFFIND, I really like patch CTF, but for tough cases CTFFIND can still do a better job.
Gold isn’t usually an issue on good micrographs (see below). That said, sometimes the average over the patches is not good because of the gold patch. In those cases CTFFIND4 will give a “better” (higher resolution) estimate of the CTF so that you don’t throw good micrographs away because the patch average CTF fit resolution is bad.
You can change the resolution range of the CTF fit to start a bit higher (e.g. 20 Å) to try and avoid the central gold diffraction features, but if there aren’t Thon rings in the power spectrum of the micrograph no CTF estimation program will work.
Thank you all! I highly appreciate the very informative inputs. It looks like my micrographs are simply too bad… CTFFIND did work a bit better but only confirmed, that the quality isn’t where it should/could be.
The contrast is maybe thrown off by a speckle in CTF - from graphene or carbon (6 speckles to be more accurate)? Also when possible collect over uninterrupted vitreous ice.
@DarioSB, just curious if you concluded this was a sample-specific issue or if you saw this consistently with Au-Flat grids?
Because of the 0.6/1 quantifoil shortage we have been trying 0.6/1 Au-Flats (among other things), and while our first data set looked OK from a visual inspection, the corrected power spectra are looking pretty sad. We have some amount of foil in our images as well, but generally that causes no issues for us in processing. Haven’t thought about it much, but trying to think if the 20% Pd in the Au-Flat foils could be causing issues?