Master unstable

Hi all,

I am seeing some severe instability problems on our cryosparc master server (v3.3.1+220215).
It has become unstable and usually hangs within 24 hours, and then again runs fine for limited time after a new “cryosparcm restart” command.
The webapp seems to respond by loading the pages, but no jobs are updated and no new jobs can be started.

command_rtp log is full of these error messages:

2022-02-17 23:08:39,208 RTP.MAIN             wrapper              ERROR    | JSONRPC ERROR at rtp_child_job_monitor
2022-02-17 23:08:39,208 RTP.MAIN             wrapper              ERROR    | Traceback (most recent call last):
2022-02-17 23:08:39,208 RTP.MAIN             wrapper              ERROR    |   File "/opt/bioxray/programs/cryosparc2/cryosparc2_master/cryosparc_command/command_rtp/__init__.py", line 171, in wrapper
2022-02-17 23:08:39,208 RTP.MAIN             wrapper              ERROR    |     res = func(*args, **kwargs)
2022-02-17 23:08:39,208 RTP.MAIN             wrapper              ERROR    |   File "/opt/bioxray/programs/cryosparc2/cryosparc2_master/cryosparc_command/command_rtp/__init__.py", line 2703, in rtp_child_job_monitor
2022-02-17 23:08:39,208 RTP.MAIN             wrapper              ERROR    |     new_status = cli.get_job_status(session['project_uid'], rtp_worker_juid)
2022-02-17 23:08:39,208 RTP.MAIN             wrapper              ERROR    |   File "/opt/bioxray/programs/cryosparc2/cryosparc2_master/cryosparc_compute/client.py", line 64, in func
2022-02-17 23:08:39,208 RTP.MAIN             wrapper              ERROR    |     assert False, res['error']
2022-02-17 23:08:39,208 RTP.MAIN             wrapper              ERROR    | AssertionError: {'code': 500, 'data': None, 'message': "OtherError: argument of type 'NoneType' is not iterable", 'name': 'OtherError'}
2022-02-17 23:08:39,209 RTP.BG_WORKER        background_worker    ERROR    | RTP Child Monitor Failed
2022-02-17 23:08:39,209 RTP.BG_WORKER        background_worker    ERROR    | Traceback (most recent call last):
2022-02-17 23:08:39,209 RTP.BG_WORKER        background_worker    ERROR    |   File "/opt/bioxray/programs/cryosparc2/cryosparc2_master/cryosparc_command/command_rtp/__init__.py", line 116, in background_worker
2022-02-17 23:08:39,209 RTP.BG_WORKER        background_worker    ERROR    |     rtp_child_job_monitor()
2022-02-17 23:08:39,209 RTP.BG_WORKER        background_worker    ERROR    |   File "/opt/bioxray/programs/cryosparc2/cryosparc2_master/cryosparc_command/command_rtp/__init__.py", line 176, in wrapper
2022-02-17 23:08:39,209 RTP.BG_WORKER        background_worker    ERROR    |     raise e
2022-02-17 23:08:39,209 RTP.BG_WORKER        background_worker    ERROR    |   File "/opt/bioxray/programs/cryosparc2/cryosparc2_master/cryosparc_command/command_rtp/__init__.py", line 171, in wrapper
2022-02-17 23:08:39,209 RTP.BG_WORKER        background_worker    ERROR    |     res = func(*args, **kwargs)
2022-02-17 23:08:39,209 RTP.BG_WORKER        background_worker    ERROR    |   File "/opt/bioxray/programs/cryosparc2/cryosparc2_master/cryosparc_command/command_rtp/__init__.py", line 2703, in rtp_child_job_monitor
2022-02-17 23:08:39,209 RTP.BG_WORKER        background_worker    ERROR    |     new_status = cli.get_job_status(session['project_uid'], rtp_worker_juid)
2022-02-17 23:08:39,209 RTP.BG_WORKER        background_worker    ERROR    |   File "/opt/bioxray/programs/cryosparc2/cryosparc2_master/cryosparc_compute/client.py", line 64, in func
2022-02-17 23:08:39,209 RTP.BG_WORKER        background_worker    ERROR    |     assert False, res['error']
2022-02-17 23:08:39,209 RTP.BG_WORKER        background_worker    ERROR    | AssertionError: {'code': 500, 'data': None, 'message': "OtherError: argument of type 'NoneType' is not iterable", 'name': 'OtherError'}

Any idea on what is going on?
And even better how to fix it?

Best,
Jesper
@jelka Please can you provide some additional information:

  • cryosparcm log command_core
  • df (to check for intermittent storage access disruptions)
  • cryosparcm status | grep -v CRYOSPARC_LICENSE_ID
  • Are you running cryoSPARC jobs through the Live interface?

Thanks for your reply wtempel,
The situation have turned to the worse, as no jobs can run anymore. Not even after cryosparcm restart.

cryosparcm log command_core now says:

2022-02-20 13:19:41,004 COMMAND.SCHEDULER    scheduler_run_core   INFO     | Jobs Queued: [('P245', 'J3'), ('P237', 'J192'), ('P556', 'J93'), ('P260', 'J408')]
2022-02-20 13:19:41,006 COMMAND.SCHEDULER    scheduler_run_core   INFO     | Licenses currently active : 1
2022-02-20 13:19:41,006 COMMAND.SCHEDULER    scheduler_run_core   INFO     | Now trying to schedule J3
2022-02-20 13:19:41,006 COMMAND.SCHEDULER    scheduler_run_core   INFO     |    Scheduling directly onto master node cryosparc.bioxray.au.dk
2022-02-20 13:19:41,006 COMMAND.BG_WORKER    background_worker    ERROR    | Job Scheduler failed
2022-02-20 13:19:41,006 COMMAND.BG_WORKER    background_worker    ERROR    | Traceback (most recent call last):
2022-02-20 13:19:41,006 COMMAND.BG_WORKER    background_worker    ERROR    |   File "/opt/bioxray/programs/cryosparc2/cryosparc2_master/cryosparc_command/command_core/__init__.py", line 223, in background_worker
2022-02-20 13:19:41,006 COMMAND.BG_WORKER    background_worker    ERROR    |     scheduler_run_core() # sets last run time
2022-02-20 13:19:41,006 COMMAND.BG_WORKER    background_worker    ERROR    |   File "/opt/bioxray/programs/cryosparc2/cryosparc2_master/cryosparc_command/command_core/__init__.py", line 1931, in scheduler_run_core
2022-02-20 13:19:41,006 COMMAND.BG_WORKER    background_worker    ERROR    |     assert all( v==0 for k,v in slots_needed.items() ), "Master direct jobs cannot have any slots needed"
2022-02-20 13:19:41,006 COMMAND.BG_WORKER    background_worker    ERROR    | AssertionError: Master direct jobs cannot have any slots needed

The “Master direct jobs cannot have any slots needed” is seen in web-GUI upon job submission to SLURM cluster.

“df” works fine and gives the mounted volumes. No errors here.

cryosparcm status | grep -v CRYOSPARC_LICENSE_ID:

----------------------------------------------------------------------------
CryoSPARC System master node installed at
/opt/bioxray/programs/cryosparc2/cryosparc2_master
Current cryoSPARC version: v3.3.1+220215
----------------------------------------------------------------------------

CryoSPARC process status:

app                              RUNNING   pid 4639, uptime 0:11:17
app_dev                          STOPPED   Not started
command_core                     RUNNING   pid 4561, uptime 0:11:28
command_rtp                      RUNNING   pid 4585, uptime 0:11:24
command_vis                      RUNNING   pid 4581, uptime 0:11:25
database                         RUNNING   pid 4452, uptime 0:11:31
liveapp                          STOPPED   Not started
liveapp_dev                      STOPPED   Not started
webapp                           RUNNING   pid 4623, uptime 0:11:18
webapp_dev                       STOPPED   Not started

----------------------------------------------------------------------------
License is valid
----------------------------------------------------------------------------

global config variables:

export CRYOSPARC_MASTER_HOSTNAME="cryosparc"
export CRYOSPARC_FORCE_HOSTNAME=true
export CRYOSPARC_DB_PATH="/cryosparc_db/cryosparc_database"
export CRYOSPARC_BASE_PORT=39000
export CRYOSPARC_DEVELOP=false
export CRYOSPARC_INSECURE=false
export CRYOSPARC_HEARTBEAT_SECONDS=3600
export CRYOSPARC_CLIENT_TIMEOUT=3600
export CRYOSPARC_DISABLE_IMPORT_ON_MASTER=true
export CRYOSPARC_MONGO_CACHE_GB=16

And this is not through CS-Live interface

I also just ran a MongoDB repair, just in case something was broken there, which did not report any errors.

Best,
Jesper

Okay, I got it going again.
Job P245_j3 was blocking the scheduler and as soon as I cleared that job, all the others started.
Is a single job supposed to be able to block all other jobs from starting?

Best,
Jesper

Back to the original problem:
webapp is crashed again, jobs seems to still be running on SLURM nodes.

cryosparcm log webapp | tail -n 20

[PUB] job.events: { project_uid: 'P245', job_uid: 'J192' } 100 0
[PUB] events.countAfterCheckpoint
job_connect_group
{"project_uid":"P245","source_group":"J192.particles","dest_group":"J193.particles"}
job_connect_group
{"project_uid":"P245","source_group":"J192.volume","dest_group":"J193.volume"}
enqueue_job
{"project_uid":"P245","job_uid":"J193","lane":"GPU (snokes)"}
==== [jobs] project query user  5f5f13dbfdfda4af9df3a243 au583564 false
==== [workspace] project query user  5f5f13dbfdfda4af9df3a243 au583564 false
==== [jobs] project query user  5f5f13dbfdfda4af9df3a243 au583564 false
[PUB] job.events.checkpoints: { project_uid: 'P245', job_uid: 'J193', type: 'checkpoint' }
set_user_viewed_job
["5f5f13dbfdfda4af9df3a243","P245","W4","J193"]
[PUB] job.events: { project_uid: 'P245', job_uid: 'J193' } 100 0
[PUB] events.countAfterCheckpoint
delete_job
{"project_uid":"P589","job_uid":"J2"}

cryosparcm log command_core | tail -n 20

2022-02-22 09:19:05,914 COMMAND.CORE         run                  INFO     | Received task layout_tree with 4 args and 0 kwargs
2022-02-22 09:19:06,043 COMMAND.CORE         run                  INFO     | Completed task in 0.12868404388427734 seconds
2022-02-22 09:19:06,043 COMMAND.CORE         run                  INFO     | Received task layout_tree with 4 args and 0 kwargs
2022-02-22 09:19:06,143 COMMAND.CORE         run                  INFO     | Completed task in 0.09934520721435547 seconds
2022-02-22 09:19:06,998 COMMAND.CORE         run                  INFO     | Received task dump_job_database with 2 args and 0 kwargs
2022-02-22 09:19:06,999 COMMAND.CORE         run                  INFO     | Completed task in 0.001178741455078125 seconds
2022-02-22 09:19:06,999 COMMAND.CORE         run                  INFO     | Received task dump_job_database with 2 args and 0 kwargs
2022-02-22 09:19:07,017 COMMAND.CORE         run                  INFO     | Completed task in 0.018148422241210938 seconds
2022-02-22 09:19:07,017 COMMAND.CORE         run                  INFO     | Received task layout_tree with 4 args and 0 kwargs
2022-02-22 09:19:07,145 COMMAND.CORE         run                  INFO     | Completed task in 0.12763023376464844 seconds
2022-02-22 09:19:07,145 COMMAND.CORE         run                  INFO     | Received task layout_tree with 4 args and 0 kwargs
2022-02-22 09:19:07,244 COMMAND.CORE         run                  INFO     | Completed task in 0.09859633445739746 seconds
2022-02-22 09:19:33,133 COMMAND.CORE         run                  INFO     | Received task dump_job_database with 2 args and 0 kwargs
2022-02-22 09:19:33,238 COMMAND.CORE         run                  INFO     | Completed task in 0.10562968254089355 seconds
2022-02-22 09:19:33,238 COMMAND.CORE         run                  INFO     | Received task dump_job_database with 2 args and 0 kwargs
2022-02-22 09:19:33,257 COMMAND.CORE         run                  INFO     | Completed task in 0.01867818832397461 seconds
2022-02-22 09:19:33,257 COMMAND.CORE         run                  INFO     | Received task layout_tree with 4 args and 0 kwargs
2022-02-22 09:19:33,260 COMMAND.CORE         run                  INFO     | Completed task in 0.003106355667114258 seconds
2022-02-22 09:19:33,261 COMMAND.CORE         run                  INFO     | Received task layout_tree with 4 args and 0 kwargs
2022-02-22 09:19:33,263 COMMAND.CORE         run                  INFO     | Completed task in 0.0025780200958251953 seconds

It looks like webapp crashes right after a job is deleted.
Any suggestions how to stabilize master would be most welcome.

Is it possible to restart webapp, without crashing running jobs?

Best,
Jesper

Okay, I discovered that a “kill -9” to the webapp process, works like a charm on a running master.
webapp is automatically relaunched without SLURM jobs crashing and one can even launch new jobs again.
This is a acceptable temporary hack for the unstable webapp for the time being.
Can CS team confirm that this is okay to do?

1 Like

@jelka Please can you provide more details on your cluster setup:

  • Are the cryoSPARC master processes in any way controlled by SLURM?
  • Could the cryoSPARC master processes conflict with other workloads on the cryosparc host, such as SLURM jobs or another cryoSPARC instance?

It is a dedicated master node with no worker.
SLURM jobs are submitted to workers.
The only workloads that it experiences are the master forced ones like imports and interactive jobs (e.g. curate exposures and select 2D classes).

But as mentioned in another thread:
https://discuss.cryosparc.com/t/issues-with-login-on-the-cs-webinterface-for-some-users/7736/11
It is a rather big install, with MongoDB at +550GB and +20 simultaneous users.

@jelka Please can you post the complete webapp log:
cryosparcm log webapp > path_to_output
What is the job type of P245 J3?
Sending kill -9 to the webapp process is okay, but should not be necessary once the underlying problem has been identified and corrected.

@wtempel The P245_J3 was a Import Movies job.
The entire webapp log is currently 41 MB, do really what all that?
If so, maybe I can send it off-list to you?

I realize kill -9 to webapp is not ideal, but nice to know this can revive webapp, if stalled, without killing running jobs.

We see the same symptoms on our instances. It looks like the nodejs webapp stops handling requests, but otherwise the application appears to continue running fine.

My impression was that this happens more ofthen when there are jobs running on the master node, but I have no hard evidence for this. Current version: v3.3.1+211202 (I believe this bug exists since 3.0, definitely there for a while)

Has there been any progress on identifying this problem?

1 Like

@ebirn May we have a look at the command_core and webapp logs?
cryosparcm log command_core > core_out_20220329
cryosparcm log webapp > webapp_out_20220329

@ebirn Thank you for sharing the logs. Unfortunately, they didn’t reveal to me a cause for the webapp’s stalling. Since you have the impression that the issue could be linked to jobs running on the master node, I wonder:
What processor(s)
cat /proc/cpuinfo | grep -A5 -B5 "model name" | tail -n 11
and how much RAM does the master node have (free -g)?

When the issue occurs:

  • How much RAM is used between the various modes (from htop Mem: used/buffers/cache)?
  • How many, what type of jobs are running on the master node (Resource Manager near lower left corner of the GUI)?

CPU information

cryosparc-1 ~]$ cat /proc/cpuinfo | grep -A5 -B5 "model name" | tail -n 11
processor	: 3
vendor_id	: GenuineIntel
cpu family	: 6
model		: 85
model name	: Intel(R) Xeon(R) Gold 6140 CPU @ 2.30GHz
stepping	: 4
microcode	: 0x2006906
cpu MHz		: 2300.000
cache size	: 25344 KB
physical id	: 6
cryosparc-1 ~]$ lscpu
Architecture:        x86_64
CPU op-mode(s):      32-bit, 64-bit
Byte Order:          Little Endian
CPU(s):              4
On-line CPU(s) list: 0-3
Thread(s) per core:  1
Core(s) per socket:  1
Socket(s):           4
NUMA node(s):        1
Vendor ID:           GenuineIntel
CPU family:          6
Model:               85
Model name:          Intel(R) Xeon(R) Gold 6140 CPU @ 2.30GHz
Stepping:            4
CPU MHz:             2300.000
BogoMIPS:            4600.00
Hypervisor vendor:   VMware
Virtualization type: full
L1d cache:           32K
L1i cache:           32K
L2 cache:            1024K
L3 cache:            25344K
NUMA node0 CPU(s):   0-3
Flags:               fpu vme de pse tsc msr pae mce cx8 apic sep mtrr pge mca cmov pat pse36 clflush dts mmx fxsr sse sse2 ss syscall nx pdpe1gb rdtscp lm constant_tsc arch_perfmon pebs bts nopl xtopology tsc_reliable nonstop_tsc cpuid pni pclmulqdq ssse3 fma cx16 pcid sse4_1 sse4_2 x2apic movbe popcnt tsc_deadline_timer aes xsave avx f16c rdrand hypervisor lahf_lm abm 3dnowprefetch cpuid_fault invpcid_single pti ssbd ibrs ibpb stibp fsgsbase tsc_adjust bmi1 hle avx2 smep bmi2 invpcid rtm mpx avx512f avx512dq rdseed adx smap clflushopt clwb avx512cd avx512bw avx512vl xsaveopt xsavec xsaves arat pku ospke flush_l1d arch_capabilities

Memory (32G)

cryosparc-1 ~]$ free -g
              total        used        free      shared  buff/cache   available
Mem:             31           8           0           0          21          21
Swap:             0           0           0

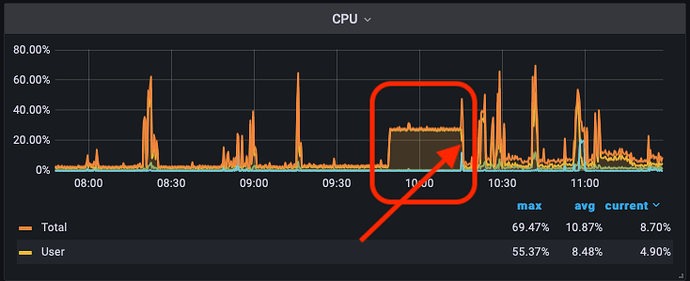
We had an event this morning, during that time, monitoring of the node indicates that 7GB memory were used, and a load of 1, i.e. 1 process running, compare the cpu graph… it started hanging ca 09:45 and was restarted ca 10:15 (indicated by the arrow)

@ebirn Interesting. Reconciliation of that time plot with entries in the command_core and webapp logs may provide some insights.

@jelka @ebirn We found that deletion of large projects can affect the responsiveness of the user interface. Yesterday’s patch includes changes to the project deletion process.

Great, thanks a lot!