Hi cryoSPARC Dev Team,
We recently updated our cryoSPARC instance from v3.3.2 to v4.3. Additionally, we updated the OS from CentOS 7 to Ubuntu 22.04. The cryoSPARC installation was on a separate /home partition and was untouched during the OS update.
After the OS update, cryoSPARC was simply updated using the command:
cryosparcm update
Until here, everything ran very smoothly. The new interface loaded, and we can access all the previous jobs.
However, the interface is now super slow. The elements inside cryoSPARC (e.g., after clicking on a job) are loading very slowly. The first very odd thing was during “Select 2D.” Either from the cart or building from scratch, from time to time, cryoSPARC asks us to queue this job on a worker - which fails. After waiting some time, we can actually queue the job on the master node.
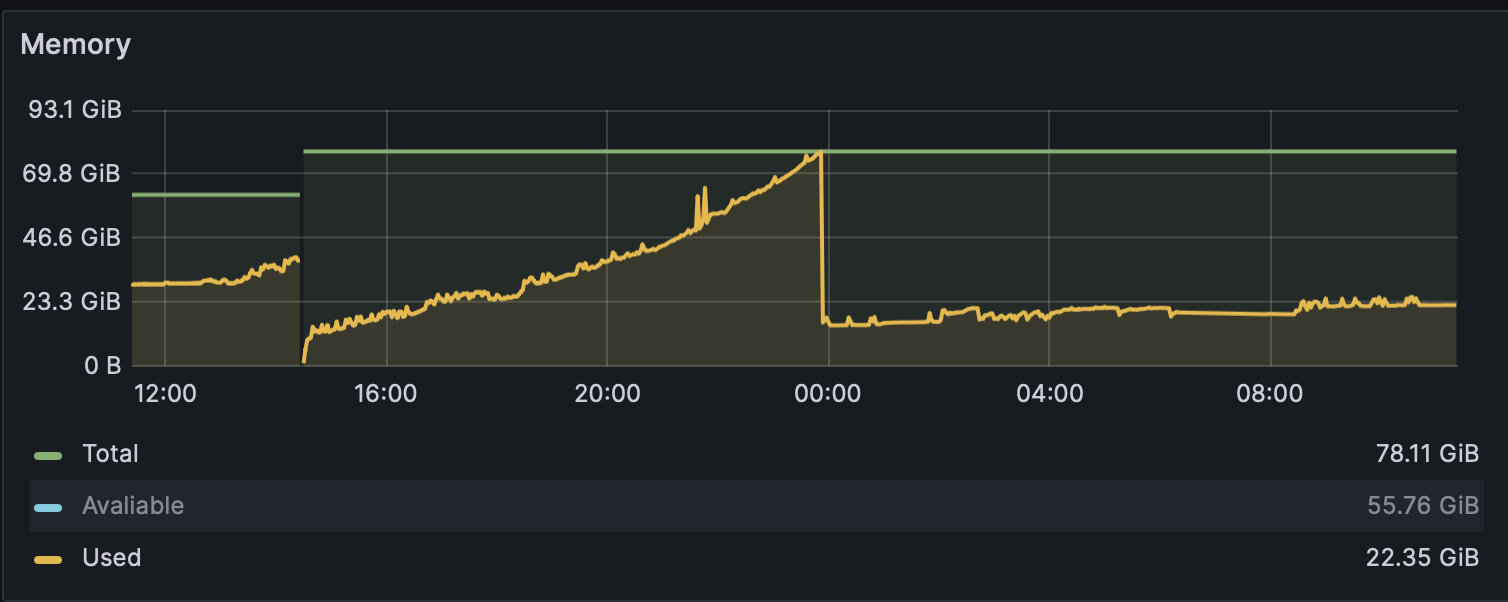
To identify the issue of the slow interface, I checked the server’s load: The CPU load is low, with peaks up to 25% (100% if there is a current job executed). But the memory is really loaded; 50 out of 62 GB are full.
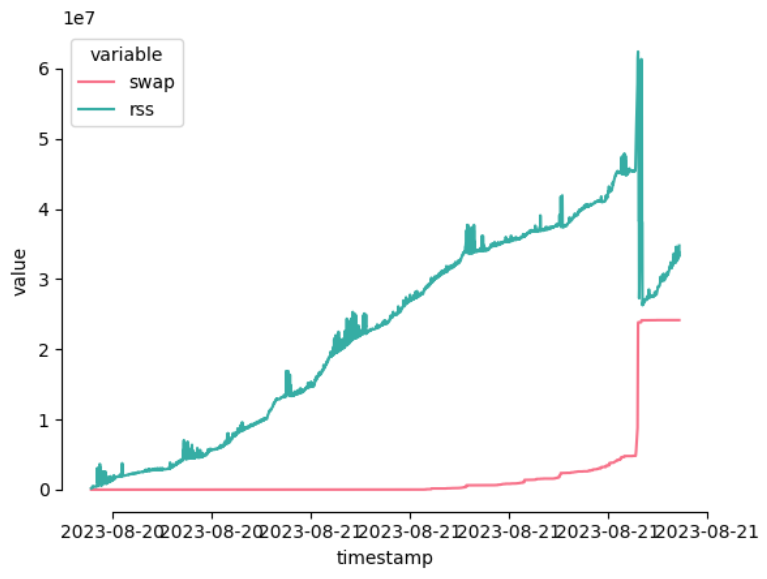
PID 	 SWAP 	 RSS 	 COMMAND
9564 	 15.4G 	 43.9G 	 python -c import cryosparc_command.command_core as serv; serv.start(port=39002)
9463 	 835.5M 	 3.3G 	 mongod --auth --dbpath /home/cryosparc_user/cryosparc/cryosparc_database --port 39001 --oplogSize 64 --replSet meteor --nojournal --wiredTigerCacheSizeGB 4 --bind_ip_all
9657 	 619.0M 	 1.2G 	 /home/cryosparc_user/cryosparc/cryosparc_master/cryosparc_app/api/nodejs/bin/node ./bundle/main.js
9598 	 27.3M 	 155.2M 	 python -c import cryosparc_command.command_rtp as serv; serv.start(port=39005)
9639 	 14.8M 	 103.7M 	 node dist/server/index.js
The command_core of cryoSPARC is using 43G of RAM and an additional 15G of Swap. I suspect that this is the reason why the interface is so unresponsive.
We currently have the legacy web app active, but stopping it does not reduce memory usage.
Our master node has the following specifications:
- Intel(R) Xeon(R) CPU E3-1225 v5 @ 3.30GHz (4 cores)
- 64 GB Memory
- 741 GB home partition (where cryoSPARC is residing)
Any idea why this command_core process is using that much memory? Currently, our users are running some important jobs, so restarting cryoSPARC is not possible at the moment. As soon as this is possible, I’ll try a simple restart of the cryoSPARC instance.
Best, Christian