3DVA Plot components raw values (update?)

Hi @team ,

following this thread on making plots from 3DVA outputs (3DVA plot raw values - #2 by vperetroukhin), has there been changes on how to access these data or should I use the strategy described?

I want to plot in 2D component x vs component y (0vs1, 1 vs 2, etc…) and change the color of the dots, axis, etc…

Thank you.
Vincent

Hi @vincent! Since that post we’ve released CryoSPARC Tools, which makes accessing information like this much easier. For instance, this code will get you a dataframe with variability components 0, 1, and 2 each in their own column:

from cryosparc.tools import CryoSPARC
import json
import pandas as pd

# you'd need to change this part to use your login info
with open('/u/rposert/instance-info.json', 'r') as f:
    instance_info = json.load(f)
cs = CryoSPARC(**instance_info)
assert cs.test_connection()

project_number = "P312"
job_number = "J54"

project = cs.find_project(project_number)
job = project.find_job(job_number)
particles = job.load_output("particles")

df = pd.DataFrame({
    'c0': particles['components_mode_0/value'],
    'c1': particles['components_mode_1/value'],
    'c2': particles['components_mode_2/value']
})

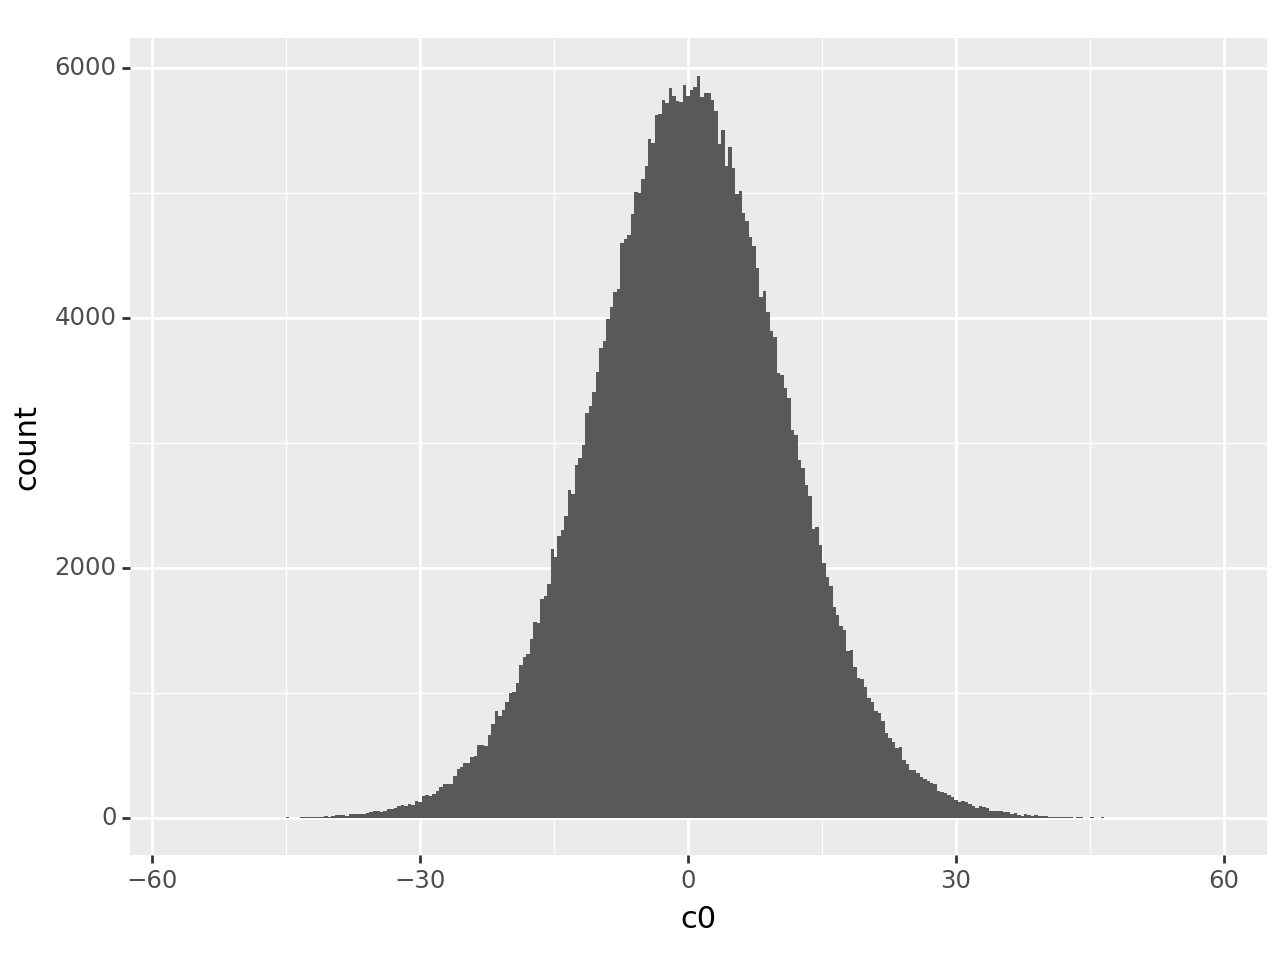
From there you could use whichever plotting library you like, or export the data to a .csv or other formats:

import plotnine
(
    plotnine.ggplot(df, plotnine.aes('c0'))
    + plotnine.geom_histogram()
)

Thanks @rposert , I’ll give it a go.

Dear @rposert
Is there such file named “instance-info”? This instance-info should contains information such as log in etc. But only file that contains such information is “config.sh” in mater mode. In your different post, you indicated that instance-info is located in home directory - but I have never found it.
Can you clarity ?
Thanks. Best
Yuro

Hi @yurotakagi – you have to make instance-info.json yourself. This file contains your login information for the CryoSPARC instance (typically your email and whatever password you set), not the login information for the node.

You can find more information about instance-info.json here or, if you prefer, you can manually enter the necessary information into the CryoSPARC() call like in the example here.

Sorry that wasn’t clear, I hope it makes more sense now!

Dear @rposert
Thanks for your clarification. What you said makes a very good sense. Thanks for your help.
Best Yuro

Dear @rposert
I have two more technical questions. My knowledge of python is very limited and thus need your help.

  1. When you use Cryosparc-tool to get the data out from cryosparc instance, do you have to “stop” cryosparc? Or can you do it while it is running? It looks like the script indicates that you use the same port (e.g., 39000) to access to the instance - so I assume that you can’t do that when the cryosparc is running as it uses the same port to connect to web browser.

  2. Based the information you provided, I wrote the script to gain access to PCA data but it is not really working but nonetheless I just want to see if the script is correct:
    from cryosparc.tools import CryoSPARC

import pandas as pd

license = “xxxxxxxxxxxxxxxxxxxxxxxxxx”
email = “xxxx”@yyyyyy
password = “xxxxxuuyy”
cs = CryoSPARC(
license=license,
email=email,
password=password,
host=“localhost”,
base_port=39000
)
assert cs.test_connection()

project = cs.find_project(“P7”)
job = project.find_job(“J349”)
particles = job.load_output(“particles”)

df = pd.DataFrame({
‘c0’: particles[‘components_mode_0/value’],
‘c1’: particles[‘components_mode_1/value’],
‘c2’: particles[‘components_mode_2/value’]
})

Thanks for your help
Best. Yuro

Hi @yurotakagi!

No, you do not need to stop CryoSPARC to access the data (in fact, CryoSPARC must be running!). The script accesses CryoSPARC using the same port as everything else, but that’s okay. To simplify a bit, you can only host one service at each port, but any number of things can connect to that port.

Can you please post (as text) the error you get when the script you posted fails?

Dear @rposert

The error message I got is the following:

Traceback (most recent call last):
File “”, line 1, in
ModuleNotFoundError: No module named ‘pandas’

Essentially there is no pandas in the library. I have tried to install it via pip but no success. Perhaps I should have install python via anaconda3 instead of just python via Red Hat.

one more thing: I have installed cryosparc-tool in PyCharm which also contains pandas. But it is in my Macbook not in linux workstation where cryosparc instance resides. I can remotely access to the instances via ssh but I don’t know how to run python script via my Macbook.
Please advice
Thanks for your help
Best Yuro

Hi @yurotakagi, no worries. Let’s try to get it working on your macbook, since that way we don’t have to worry about permissions. Here is how I would install cryosparc-tools on my mac:

1. Install miniconda

If you already have conda installed, skip this step

Following the instructions here (Installing on macOS — conda 24.1.3.dev60 documentation), install miniconda.

2. Create a conda environment

Generally, it is best practice to use virtual environments with python. This helps avoid conflicts if certain packages need specific versions of other packages.

I will use this command to create a python environment called cs-tools:

conda create --name cs-tools python=3

3. Install cryosparc tools and other libraries

We must activate the virtual environment before installing packages or using cryosparc tools. One way to check which environment you’re in is conda info --envs:

$ conda info --envs 
# conda environments:
#
base                  *  /Users/rposert/miniconda3
cs-tools                 /Users/rposert/miniconda3/envs/cs-tools

Right now, I’m in my base environment. I do not want to install packages there! If I first activate my cs-tools environment:

$ conda activate cs-tools

we can see that I am now in the correct environment:

$ conda info --envs 
# conda environments:
#
base                     /Users/rposert/miniconda3
cs-tools              *  /Users/rposert/miniconda3/envs/cs-tools

Note that the * is now next to the cs-tools path instead of the base path.

We can now install the packages we need! In addition to the packages that cryosparc-tools requires, I find these packages useful when writing scripts and inspecting data:

  • pandas, for inspecting data as a data frame
  • matplotlib, for simple plots

so we can install the packages to the virtual environment like so:

$ python -m pip install cryosparc-tools pandas matplotlib

Now the environment is ready to go!

4. Set up SSH tunnels

We now need to set up some SSH tunnels so that our computer can connect to the cluster which hosts CryoSPARC. If your CryoSPARC installation uses the default base port of 39000, we can set up the required tunnels like so:

ssh -N -L 39000:localhost:39000 -L 39002:localhost:39002 -L 39003:localhost:39003 -L 39005:localhost:39005 << master host >>

Be sure to replace << master host >> (including the << and >>) with the hostname of the CryoSPARC master!

This command opens connections from port 39000 on your computer to port 39000 on the host, 39002 on your computer to 39002 on the host, etc. CryoSPARC tools needs these connections to function.

If your base port is not 39000, you’ll need to replace the ports as appropriate. For example, if your base port was 40000, you’d need to replace all instances of 39000 with 40000, 39002 with 40002, etc.

5. Create instance-info.json

Finally, you’ll need to provide your credentials to the cryosparc-tools scripts. These are your login credentials (typically your email and a password you chose), not any information about the CryoSPARC host or admin. Create a file called instance-info.json in your home directory and add the following information:

{
        "license": "<< your license >>",
        "email": "<< the email you use to log into the CryoSPARC GUI >>",
        "password": "<< the password you use to log into the CryoSPARC GUI >>",
        "base_port": << the base port used earlier (e.g., 39000)>>,
        "host": "localhost"
}

replacing everything in and including << >> with the appropriate information. The license ID should be in the config.sh file you found earlier.

6. Run the script

Finally, you’re ready to run the scripts! If you create a python file (in this case, maybe get_particle_components.py) and add the script text to it, you can run it with python get_particle_components.py. Make sure you’re in the cs-tools conda environment!

For example, I’ll create the python file on my Desktop:

touch ~/Desktop/get_particle_components.py

and paste in the following text in the editor of my choice:

from cryosparc.tools import CryoSPARC
import json
import pandas as pd
from pathlib import Path

with open(Path.home() / 'instance-info.json', 'r') as f:
    instance_info = json.load(f)
cs = CryoSPARC(**instance_info)
assert cs.test_connection()

# change this to whatever project and job you want to use
project_number = "P312"
job_number = "J54"

project = cs.find_project(project_number)
job = project.find_job(job_number)
particles = job.load_output("particles")

df = pd.DataFrame({
    'c0': particles['components_mode_0/value'],
    'c1': particles['components_mode_1/value'],
    'c2': particles['components_mode_2/value']
})
print(df)

If I set up the SSH tunnels like in step 4, here is the result:

$ python ~/Desktop/get_particle_components.py
Connection succeeded to CryoSPARC command_core at http://localhost:39002
Connection succeeded to CryoSPARC command_vis at http://localhost:39003
Connection succeeded to CryoSPARC command_rtp at http://localhost:39005


               c0         c1         c2
0       11.774458  13.445810 -20.135124
1       11.945024   2.822657  10.567183
2       -6.311073   0.321704 -17.275665
3       -0.410764   7.178520   0.903192
4      -41.858257  20.322187  -8.610754
...           ...        ...        ...
397665   3.548247   4.151044 -12.174521
397666   0.581883 -13.682824 -10.587862
397667   0.757384 -11.042213  20.455528
397668  -2.539126  -5.445854  -1.673623
397669   7.511567  -0.164381  -3.030882

[397670 rows x 3 columns]

I hope that helps, and let me know if you run into any more problems!
3 Likes

Dear @rposert

Thanks for the detailed information. I will try it and see how things go!
Thanks for your help
All the best
Yuro

1 Like

Dear @rposert
Thanks for your instruction. I was able to get it to work. Because ssh did not work well, I did it on our Linux workstation. Yet, I do have two more questions:

  1. What kind of commands to be used to export the data ?
  2. How can I import “plotnine”. The distribution figure you show to Vincent is exactly the figure I need for a paper. So, if I can use your script describe above, it would make my life easier.
    Thanks for your help. Best. Yuro

Glad to hear you got it working @yurotakagi!

I’ll answer your other questions, I’ll assume you’re working off the example script above. So, for example, I assume you have a pandas dataframe named df, etc.

Exporting the data

To export the data, you can use the to_csv() method of your dataframe like so:

df.to_csv('components.csv', index = False)

I prefer to use index = False because the index column is, in this case, just the row number, which is not useful information.

Making a histogram

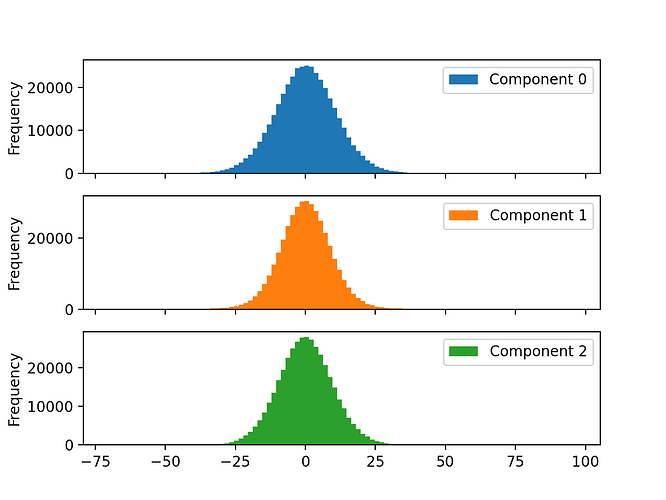
I prefer plotnine because I think about plots in terms of the R package ggplot2, but there are easier ways of making a histogram with just pandas and matplotlib (which you’ve already installed during step 3). For instance, just running:

df.columns = [x.replace('c', 'Component ') for x in df.columns]
df.plot(subplots = True, kind = 'hist', bins = 100, ylabel = 'Particles')

will generate a plot like this, where each component is in its own histogram:

you could save that plot by adding a bit more code around it:

import matplotlib.pyplot as plt
df.columns = [x.replace('c', 'Component ') for x in df.columns]
df.plot(subplots = True, kind = 'hist', bins = 100, ylabel = 'Particles')
plt.savefig('all_components.png')

Learning how to use a plottling library is challenging, but rewarding. You can start learning about matplotlib and pandas using these resources:

Plotnine

If you prefer to use and learn plotnine, first make sure you’re in your cs-tools environment (like step 3 above) then just run python -m pip install plotnine.

To produce and save a similar set of histograms as the pandas example, you can use the plotnine.ggsave() function like so:

import plotnine
histograms = (
    plotnine.ggplot(df.melt(), plotnine.aes('value', fill = 'variable'))
    + plotnine.geom_histogram(bins = 100)
    + plotnine.theme_minimal()
    + plotnine.theme(legend_position = 'none')
    + plotnine.facet_grid('variable ~ .')
    + plotnine.labs(
        y = 'Number of particles',
        x = 'Component value'
    )
)
plotnine.ggsave(histograms, 'plotnine-hists.png')

Again, plotnine and ggplot2 are powerful packages with which you can make custom data visualizations, but they take some time to learn. If you are interested, I recommend first learning ggplot2 in R, then using that knowledge in plotnine (which has mostly the same function names but poorer documentation).

Good luck!

Dear @rposert
The script you provided worked! But I have one last question: the graph came out with gray color background instead of white one you uploaded. How can I change the background color from grey to white ?
Thanks for your help
Best. Yuro

Could you please copy-paste the text of the script that produced a grey background here?

This is the one I used - it is pretty much copy and paste of your script:

import plotnine
histograms = (
plotnine.ggplot(df.melt(), plotnine.aes(‘value’, fill = ‘variable’))
+ plotnine.geom_histogram(bins = 100)
+ plotnine.theme_minimal()
+ plotnine.theme(legend_position = ‘none’)
+ plotnine.facet_grid(‘variable ~ .’)
+ plotnine.labs(
y = ‘Number of particles’,
x = ‘Component value’
)
)
plotnine.ggsave(histograms, ‘plotnine-hists.png’)

Hmm…is it possible that whatever software you’re looking at the image in puts a grey background behind transparent images? Technically, the image I posted has a transparent background. Try replacing the ggsave() line with

plotnine.ggsave(histograms, 'plotnine-hists.png', facecolor = 'white')

and see if it looks right?

1 Like

Dear @rposert

It worked. I got the graph with white background. Thanks you so much for all of your help. I sincerely appreciate it.
All the best
Yuro

2 Likes