3DVA Plot components raw values (update?)

Hi @vincent! If you have .cs files from your collaborator, you should be able to open them like so:

from cryosparc.dataset import Dataset

dset = Dataset.load("path/to/dataset.cs")

From there, the dset object will act the same as if you had loaded it using job.load_output("output_name").

Hi @rposert ,

thank you so much for your quick response.
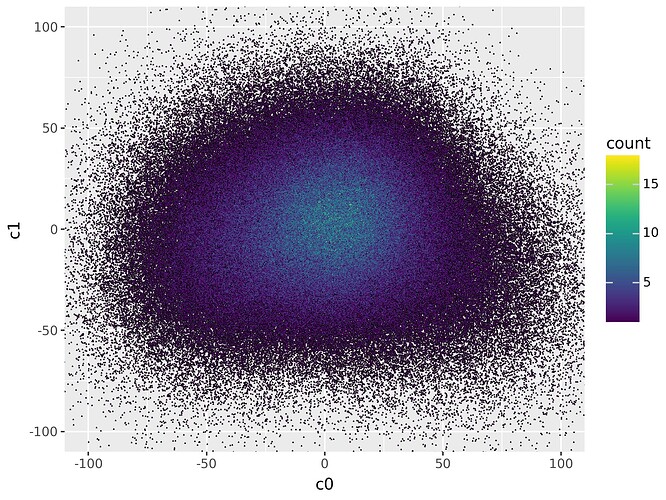
I was able to do this image using this script.
It shows a non-gaussian distribution, in which we can visualize a very interesting biological movement, highly relevant! very cool.

Cheers
Vincent

import plotnine

cloud c0 vs c1

cloud=(
plotnine.ggplot(data = df, mapping = plotnine.aes(x = β€˜c0’, y = β€˜c1’))
+ plotnine.geom_point(shape = β€œ1”, size = 0.01)
+ plotnine.geom_bin2d(bins = 1000)
+ plotnine.scale_fill_continuous(type =β€œviridis”)
+ plotnine.coord_cartesian(xlim=(-100, 100), ylim=(-100,100))
)

1 Like