I have a 3.7A structure of protein-tRNA complex. The map looks mostly clean and interpretable but it has some anisotropy.
I am trying to split two states, one with the modified tRNA and one with the unmodified tRNA (I know both species are present on the grid from other experiments).
I did 3D classification with the filter resolution of 3.7, 2 classes, initialization mode:PCA, number of epochs 3, default parameters and with the focused mask on the region of interest. Then I did Non-uniform refinement with the output maps and particles.
This generated two classes with particles split almost evenly. In The active site I observe big and small density around adenine, which could be modified and unmodified states (first picture). However, I see this weird streakiness pattern. Looking at the base pairs, in one class I see some streakiness roughly in one direction and in another class I see streakiness in a different direction (2nd picture).
My questions are, is it possible that 3D classification is splitting signal in different directions and not actual conformations?
Can I trust this data?
Also, another weird thing is cFAR score in both of this structures is doubled compared to the original map (0.20-0.25 VS 0.1). Although, the original map looks better overall.
Hi @Ana, short answer yes, it is possible for 3D classification to separate on view rather than conformation. It is also possible for one conformation to have much more significant orientation biases than another, or for misalignment to introduce spurious bias (the orientation distribution is only as accurate as the alignments). If you combine data with slightly different pixel sizes, or if the data has significant residual beam tilt - causing magnification to vary with defocus - classification could also separate on apparent size.
In addition to carefully inspecting the maps and orientation distributions of the classes and separate refinements, you could also reconstruct with the angles from the consensus refinement (which might be more accurate/consistent), and try different numbers of classes, focused masking, classification with alignment (heterogeneous refinement, or Class3D with local search in Relion), or 3D variability analysis. You can verify that aligning maps (which might shift during classification with alignment or refinement, or reflect shifts in from aligning different groups of particles) or modifying the pixel size in ChimeraX doesn’t explain the differences you see.
Your models can help as well, based on how easy it is to rebuild them into different densities and if the resulting models have good statistics and appearance.
I agree with all the things Daniel said above. Another thing you can do to validate the orientation distribution of your maps is use a reference-free method where the input map doesn’t bias the data as much, such as 2D classification, on each of your 3D classes. If you see a particular view being over-represented in the most populated classes this is a sign that orientation bias may be a problem.
Another thing that you can do to improve the reconstructions is use the Rebalance Orientations job in CryoSPARC. This will get rid of particles from over-represented angles and improve the cFAR score. Generally, the guidance is to aim for a cFAR score of ~0.5. But if the features of the map look like protein i.e. nice alpha-helix and beta-strand density in regions which are actually protein, then I’d trust maps with a cFAR as low as ~0.3.
The strange thing is cFAR for my map is 0.1 but it looks perfectly interpretable and clean, there is some streakiness but it is still good enough to confidently build a model, it looks cleaner than some maps I have seen with much higher cFAR. When I rebalance particles, it does not seem to increase cFAR too much, only maybe by 0.05, does not matter what percentile I use. What could be the reason for this?
Reconstruct the classes with the original angles, not new ones from new global alignments. I.e. send each class to homogeneous reconstruction only.
I would go by the orientation distribution, directional FSCs, and your judgement of the maps instead of one number. It may be that there are misaligned particles. Does 2D classification of the final particles suggest anything?
Interesting, it could be that you still have some junk particles/heterogeneity (e.g. not your particle of interest, protein which is not RNA-bound or RNA-which is not protein-bound, or some poor quality particles/ice) which is mostly getting put in one or a few slices in your reconstructions. If this is the case another metric which is useful for diagnosis is the Sampling Compensation Factor (SCF), which is output from the Orientation Diagnostics job in cryoSPARC. If the SCF is greater than 0.81 that generally indicates sufficient angular sampling.
Is the spread of min/max and sigma in the cFAR plot quite wide or are there a few cFSC curves which are notably worse quality? If so this could be indicative of junk.
A potential method of getting rid of junk could be: Non-uniform refinement with Per-particle Scale Factors Turned on (check the per-particle scale factor plot to see if it is bi-modal, if it is then proceed) –> Subset Particles by Statistic (separate by Per-particle scale factor) –> Use the larger number scale factor particles for subsequent refinements
But, it is important to consider all the information together i.e. 3D map quality, orientation distribution diagnostics, 2D classifications
SCF values range from 0.7-0.8 for different volumes I have generated from this dataset. cFAR min/max is fairly narrow, so yes, I think you’re right that there are few cFSCs that are significantly worse quality compared to others. Per-particle scale factor plot is not bi-modal. I have cleaned up particles using ab-initio+heterogeneous refinement and multiple rounds of 2D classification. No matter how many rounds of 2D classification I run, there are always some ambiguous looking classes at the bottom. Is this normal? I am concerned that I may have cleaned up too much. This cleanup did make the map slightly less noisy, although, it did not improve cFAR at all. What other cleaning method would you suggest?
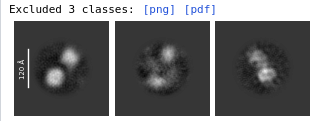
Every time I run 2D classification, there is maybe 1% or less particles in ambiguous classes at the bottom, even if I get rid of them in the previous rounds. For example, these 3 classes that have 1,300 particles combined. Is this normal? Would you get rid of them?
Due to the nature of reference-free 2D classification - and the particular implementation that CryoSPARC employs - you’ll almost always tease out a few more junk particles each time you run 2D classification.
I think these cleaning methods should suffice. You never end up getting 100% homogeneity and based on your summary of the quality metrics it sounds like a good map. If there is some orientation bias in the map caused by the junk/few particles in that orientation it could be worthwhile doing a tilted data collection to fill out that region. But this depends if you can answer the questions you want to answer with your current dataset!
Unfortunately, this is already a tilted dataset, collected at 37 degrees. Without tilting, There is only one orientation in 2D classes and map is uninterpretable. For now, the map is good enough to draw all the important conclusions. Thank you for your input, I appreciate it.