Hi
I have a previously motion corrected dataset and all the plots were fine when I used non-dose weighted images for both CTF estimation and particle extraction.

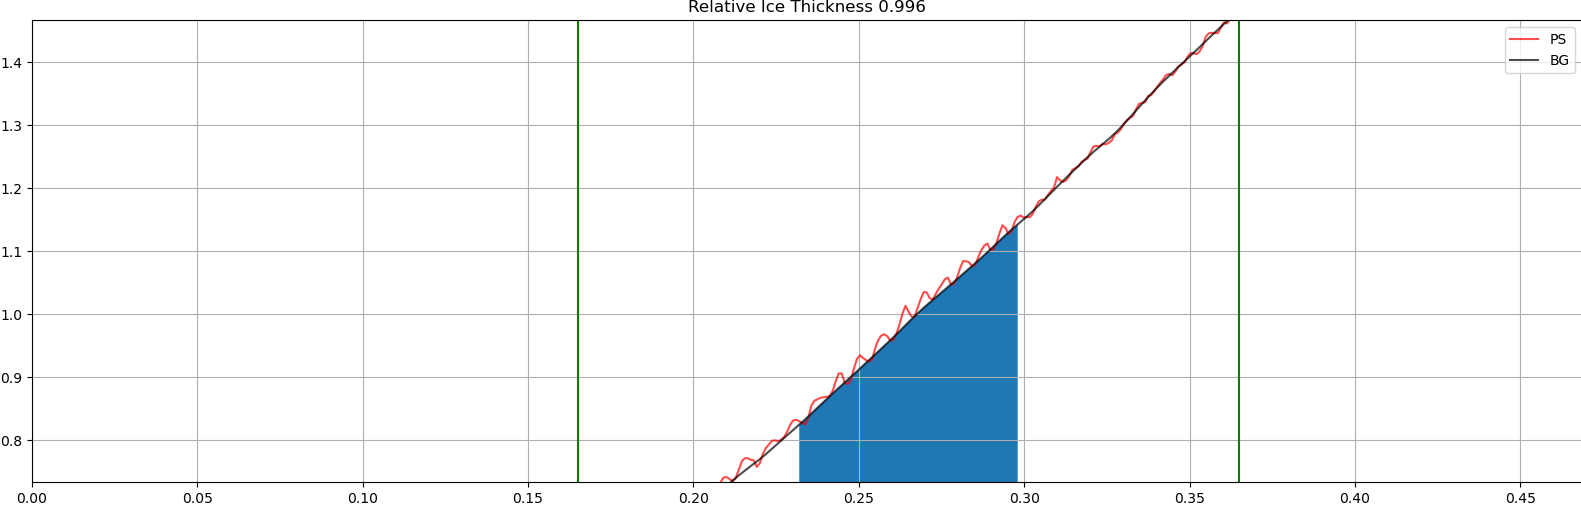
Later on, I read that it is better to use dose-weighted images for particle extraction (Dose weighted and non-dose weighted) As I didn’t have motion correction done in my cryosparc instance, I decided to try both patch CTF estimation and particle extraction with dose-weighted images. In the plots I got from the CTF estimation job, the relative ice thickness plot seems a little odd to me although the diagnostic plot with PS,CTF, and FIT is good. The ice ring location seems fine. But the curves are shooting up.
I am having trouble understanding what’s going on. Any help is appreciated