Hi,
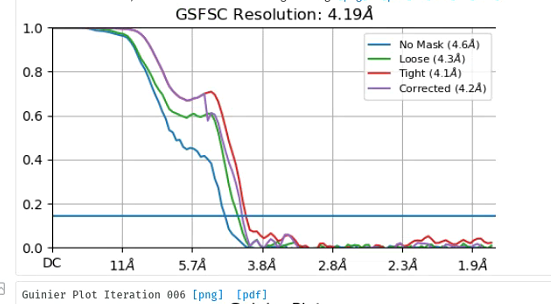
I’m new to cs. when I finished NU refinement with default settings, 250k particles from relion polish, I got the GSFSC like this. It’s a membrane protein with detergent micelle. It is a little bit different from curves in other reference. I wonder if it is normal and what I should do next? Any help is appreciated.
Are you concerned about the plateau at about 0.7? That’s likely due to the presence of the micelle and totally normal. Or are you worried about the slight movement above 0 at ~2A? That might be some duplicate particles across the 2 half sets; if that’s a problem, the “remove duplicates” job would fix it.
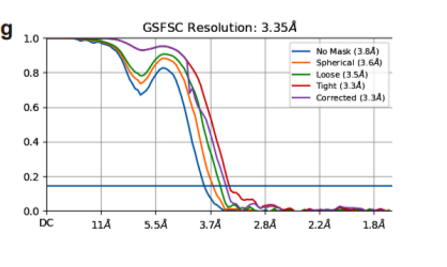
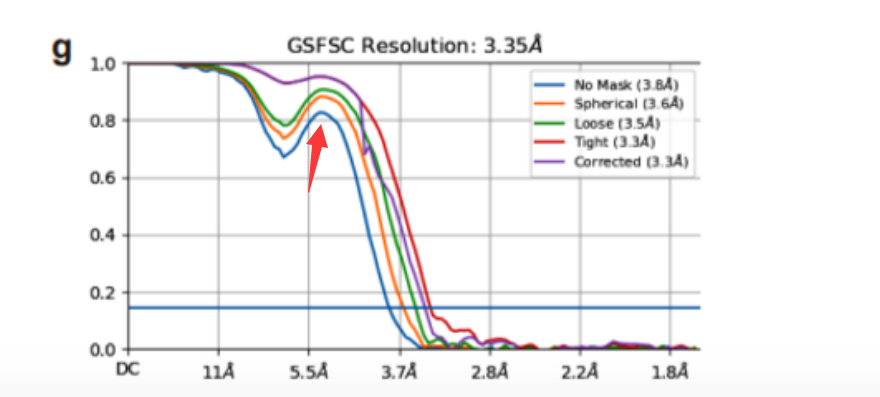
Are you asking why the second curve has tighter grouping of FSCs and why the ‘No Mask’ is going back up after going down, while in yours the no mask goes mostly straight down and never bumps back up like the loose and tight?
That’s probably something to do with non-uniformity in your particle set. Maybe you have neighboring particles that are too close, or things in your particle set that aren’t actually particles, or several different 3D conformations in your particle set? You could try throwing out your worst particles, things might improve slightly. That said, at the resolution you’re at, I’m honestly not sure.
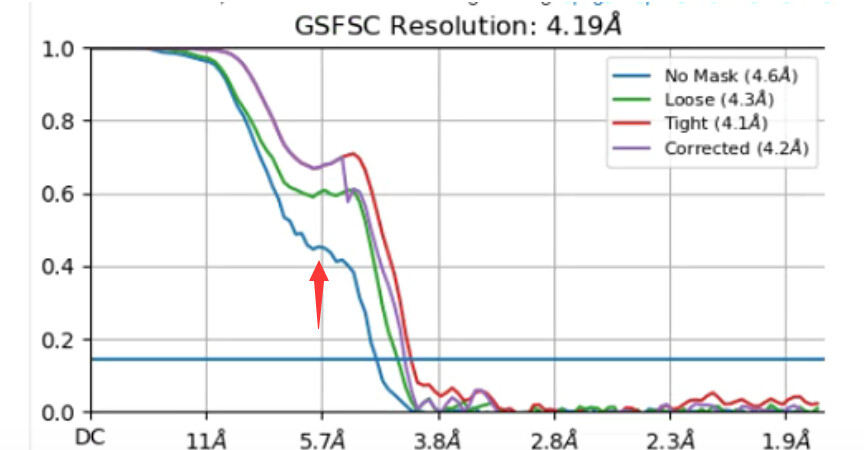
That dip is around 6-9 Angstrom, which I’ve seen before with large micelles. The tight mask having less of the dip would be consistent with a tighter mask which excludes part (or all) of the micelle density.
It doesn’t always happen, but (and I’m going to fall back on the classic phrase now)… “it depends on the data”.