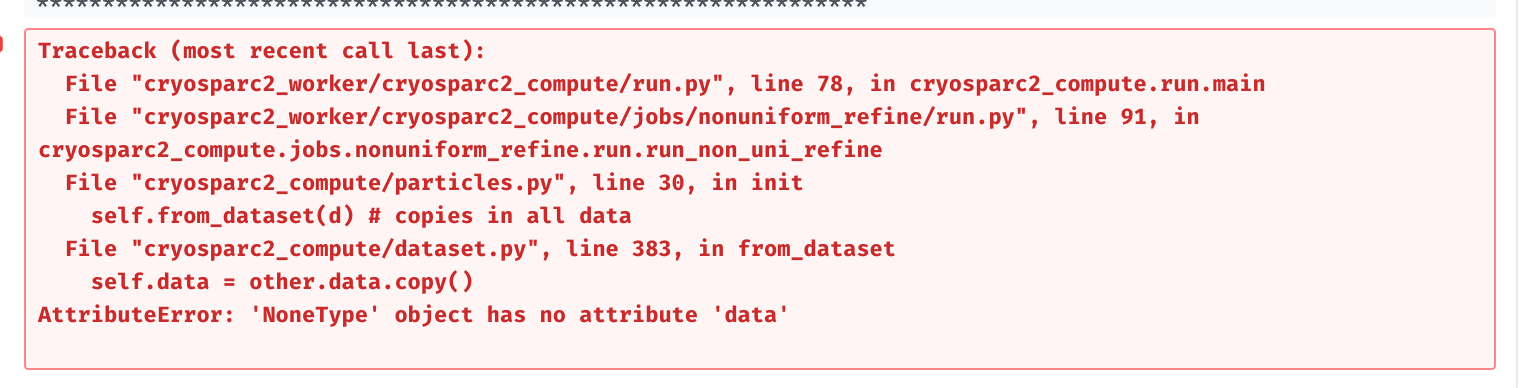
I performed 3D variability analysis in “Cluster mode” in 2.12, and wanted to then take particles belonging to a particular cluster into non uniform refinement. However, when I connect the particle output of a cluster from 3D-VA to non uniform refinement, I get the attached error.
Also - I can’t reproduce the 3D, interactive display of the clusters provided in the release notes (see below) - is this something that should be in there, or it’s not ready for release yet?
It seems like it would be helpful to have all clusters on the same set of axes, so we can see if they overlap or not.
Hi @olibclarke - there was a bug in the output of particles from cluster mode, that is fixed now and to be deployed imminently in a minor version patch.
The clusters are in fact all plotted on the same axes - each set of axes you see is a pair (or triplet if you enable 3D plots) of dimensions, but all clusters/points are plotted in all plots. Unfortunately we don’t have this interactive 3D plot capability yet in cryoSPARC - the 3D plot you posted was generated via iPython notebook (using %matplotlib notebook mode). This can be done by anyone just reading in the .cs file coming out of 3D variability that has the particle reaction coordinates (components_mode_X/value field)
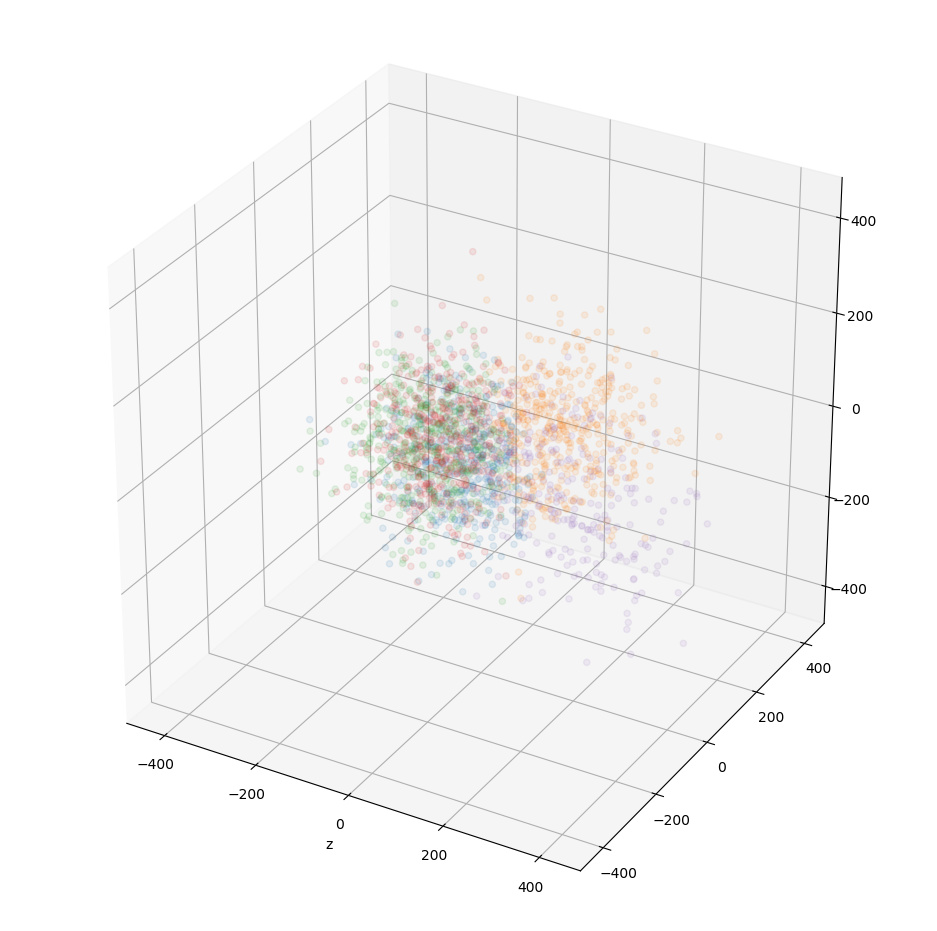
Thanks! I guess what I meant was more that with the 3D plots, there are no colors to separate particles belonging to different clusters, whereas there are in 2D plots. E.g. see below, with 5 clusters selected. I haven’t tried this in the latest update, though, so maybe it is fixed there?
@olibclarke unfortunately your image attachment didn’t come through… not sure why
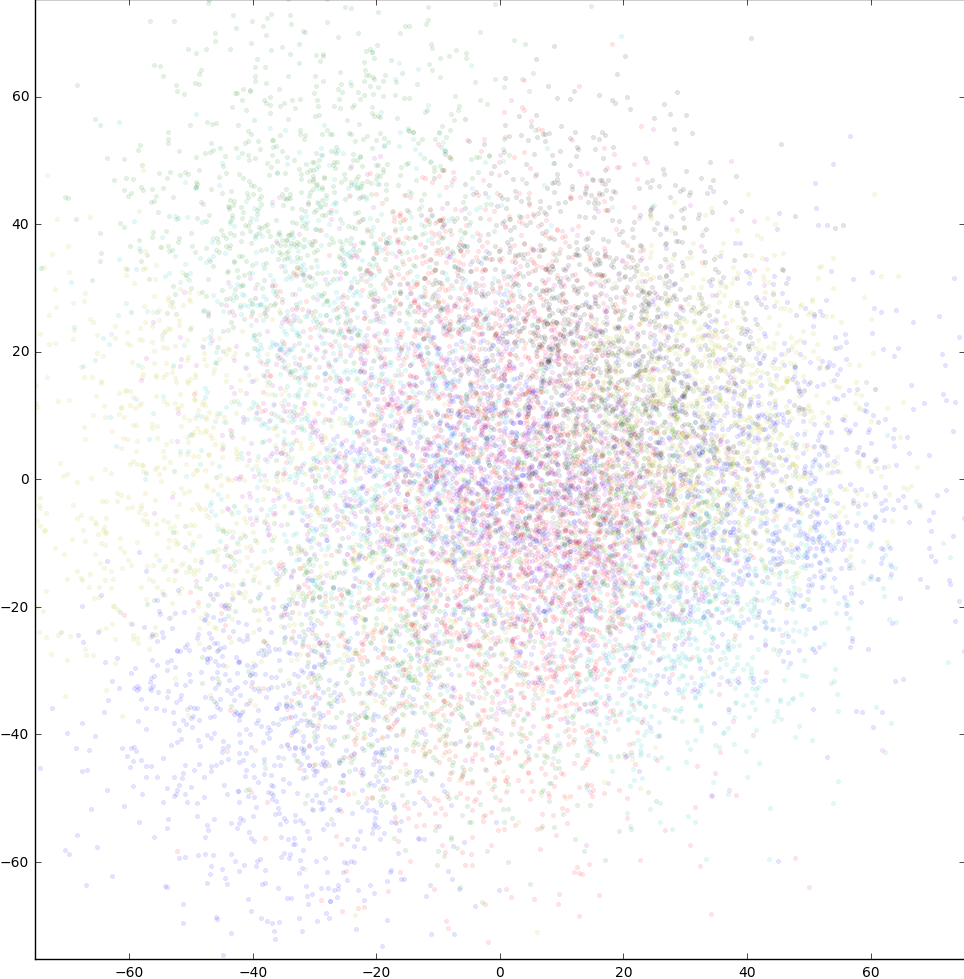
but I just ran a test both in 3D and 2D plot modes in the latest version and the colors seem to be correct:
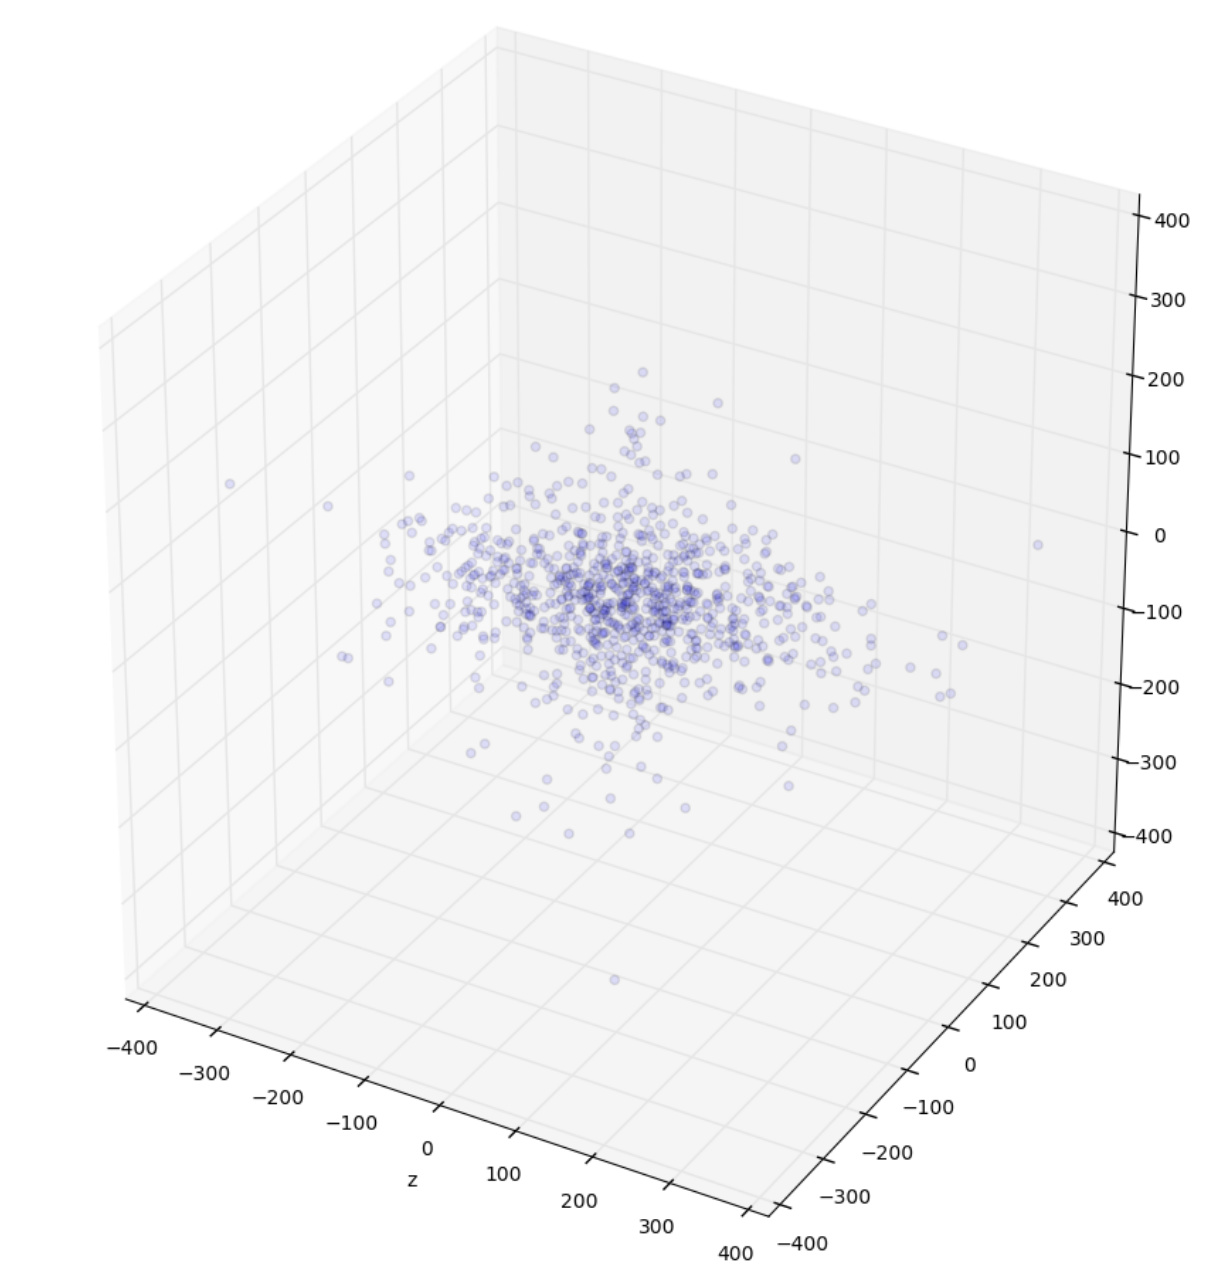
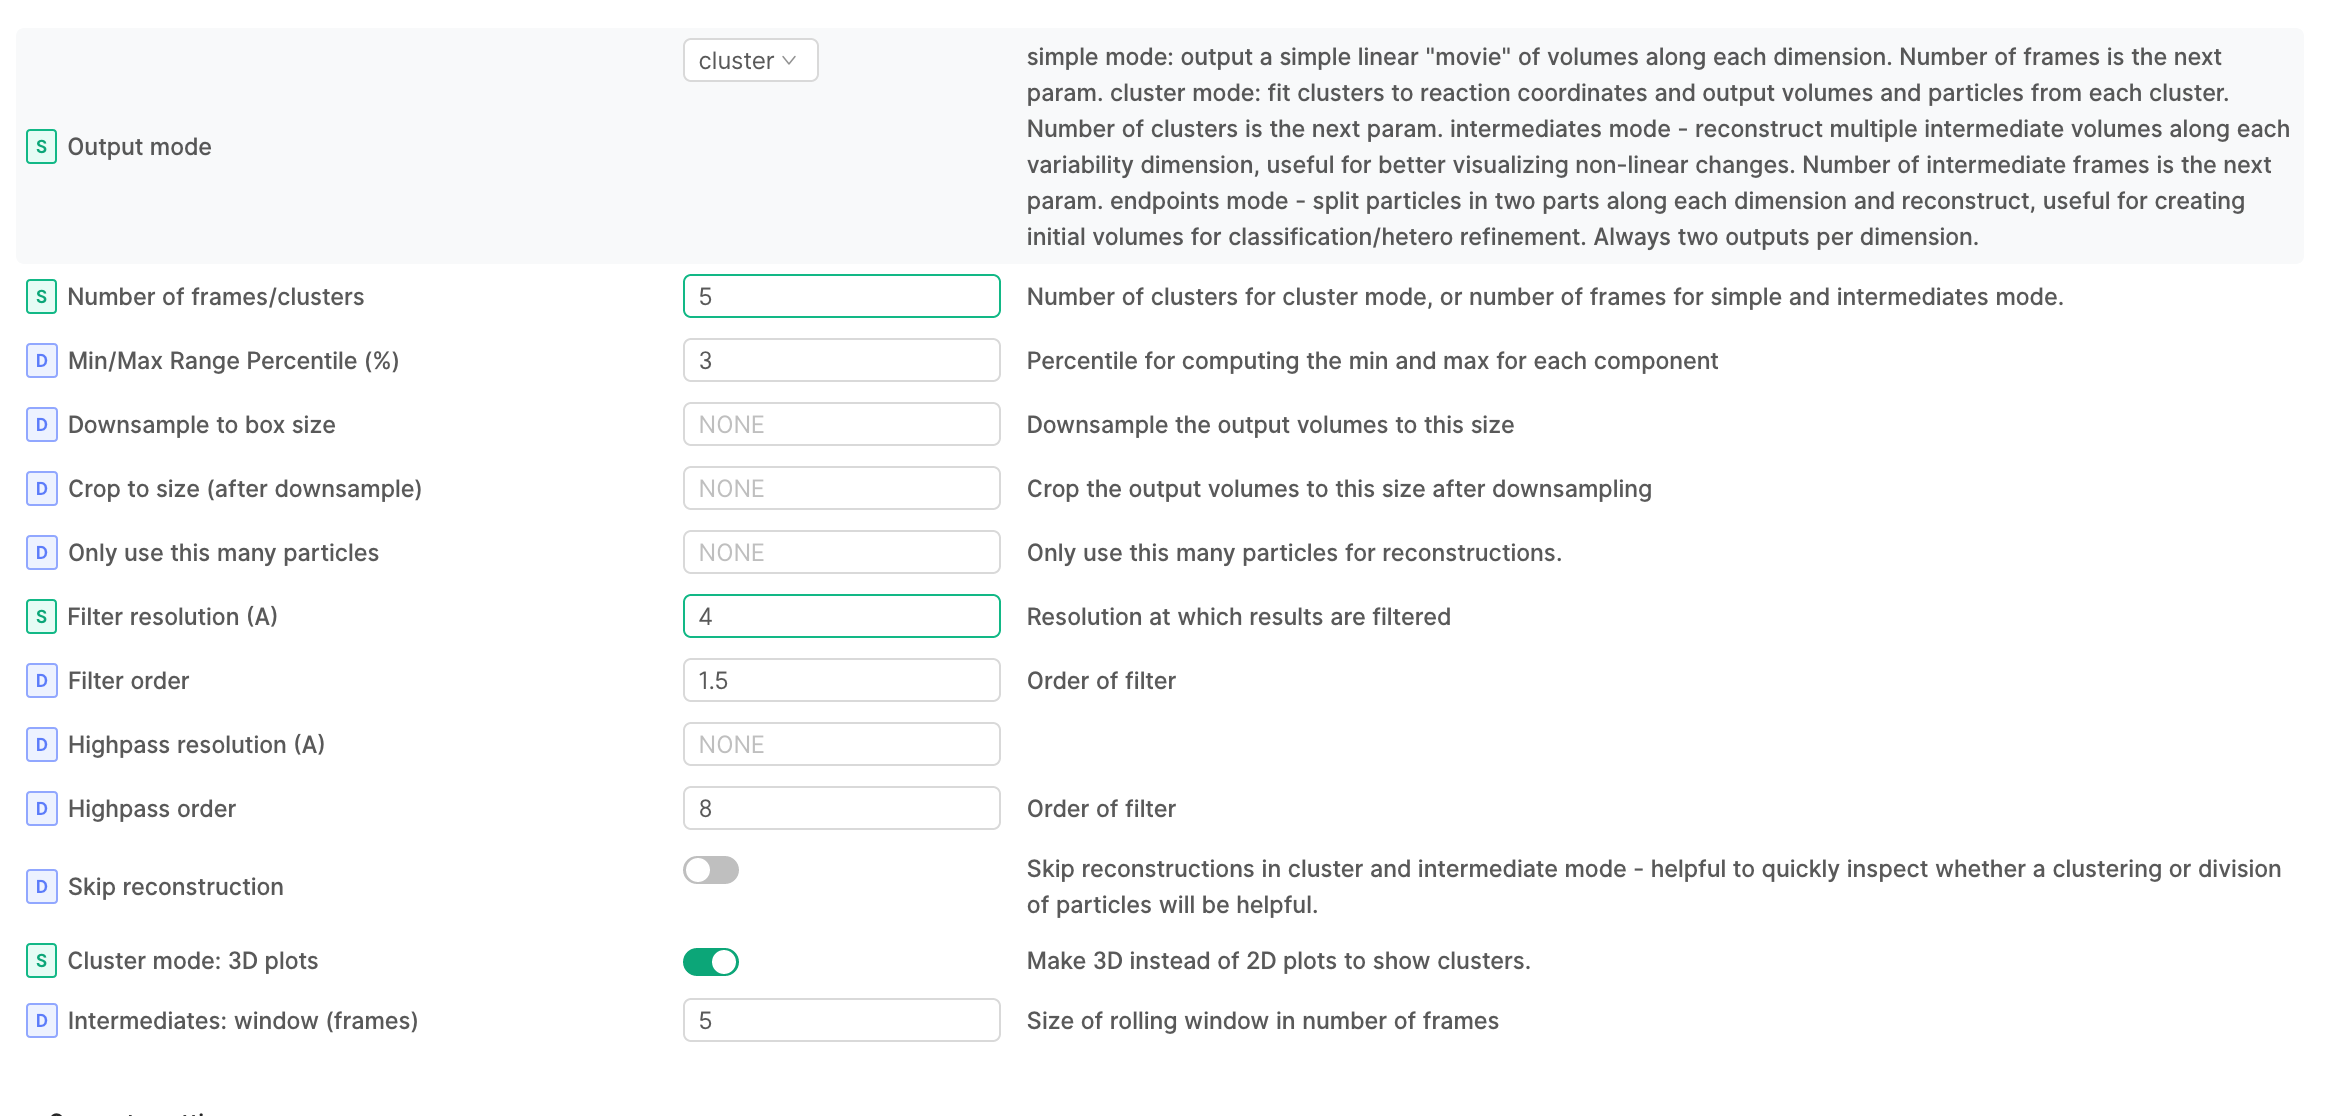
@apunjani I just re-ran this with the latest patch, but I still don’t see any color in the plots. Is there something wrong with my settings that you can see?
Hi @olibclarke this is quite strange… how many particles are reported to be found in each cluster?
There are couple possibilities: the plot only shows every 10th particle image, to make 3D plotting feasible - that could hide something. The plot also has it’s x/y/z axis limits set by taking the 99th percentile of the absolute values of the reaction coordinates in each dimension, and multiplying by 1.1. So if there are clusters that are really tiny and far from the central bulk of particles, they may be getting clipped out of the plot…
That’s not it - the clusters are reported to be roughly even in population, and I’ve reproduced this on two different datasets (of different proteins with different box size and symmetry)
I guess you have solved the problem? Just in case. It is in one color if you just look at the overview result but will change into multiple colors if you clicked to load interactive plot.