Hi,
In the 3D-VA paper (3D variability analysis: Resolving continuous flexibility and discrete heterogeneity from single particle cryo-EM - ScienceDirect), UMAP dimensionality reduction is used to better visualize clusters obtained from GMM clustering on the 8 3D-VA components.
This visualization seems really useful, as clusters can sometimes be difficult to visualize just plotting two or three components as a time. Would it be possible to add this visualization as an option in 3D-VA?
Cheers
Oli
3 Likes
I actually got part of the way to doing this with a python script (with an eye toward using it to select particles for further refinement), but my 3DVA wasn’t really separating out much heterogeneity so I stopped at plotting.
It’s kinda slow and I’m sure there’s faster/better/more informative ways of doing this, but here’s where I ended up if you’re just interested in plotting: umap_3dva.py · GitHub
You’ll need to install umap-learn (conda is easiest), pandas, seaborn, and matplotlib to use it. My plans for next steps (if I had seen nice clusters) were clustering using UMAP then using UIDs to select particles based on cluster
1 Like
sorry, cryosparc-tools is also required
Is UMAP the best choice? It’s not really any better than t-SNE…
https://twitter.com/lpachter/status/1440695021502545934?lang=en
I almost wonder if what we really need is something like factor analysis, where the PCs are just rotated into the most human-interpretable of the infinite number of equivalent (rotated) PCs.
1 Like
maybe not better than t-SNE but still better than just PCA, no? (keeping in mind that this is not my area of expertise!)
So you’re saying my data might actually have had decent clusters! 
No disagreement — I only reached for UMAP b/c I’m friends with single-cell folks. I had forgotten the point that UMAP et. al. don’t preserve neighbors. That’s probably pretty bad for this type of analysis. Is there some way to cluster in the higher dimension that does? Or do you think GMM is the best we can do?
The 3DVA spaces we’re creating aren’t that high dimensionality, like < 10, so clustering in the space is still feasible. The GMM (which is provably just “good k-means”) approach we have is one way, but has a strong dependence on K and doesn’t work with clusters that are on manifolds or have non-elliptical shapes / aren’t linearly separable.
Along the lines of the GMM display mode we already have, we could try methods like DB-SCAN or OPTICS that can identify complex cluster shapes, that aren’t linearly separable (these methods also deal naturally with outlier points, which might be nice for us). Traditional hierarchical clustering is another avenue - there are a lot of clustering algorithms in the literature and we’ve really hardly explored how best to cluster SPA data given an embedding like 3DVA, which dramatically reduces the dimension of the space (10 << box * box * no. particles) and also allows pairwise comparisons to be made.
I think Oli’s question was about visualization of the 3DVA embedding post clustering, though, rather than alternate means of coming up with different 3D classes. If we wanted to reduce a 10 component 3DVA to 2 or 3, then maybe something like multidimensional scaling with stress majorization, which “folds in” the higher dimensional separations to preserve distances, would be effective.
However, if we’re only using 3 dimensions for 3DVA, then I don’t really see the advantage to plotting a distorted embedding to “see” the clusters. The right way to see the clusters is to look at the reconstructed maps and see if they are different / interesting structures or not. Whether UMAP distorts scatter plot in a helpful or confusing way (which is not controllable) doesn’t have any affect on the biological meaning of the structures.
PS I think it would be cool to be able to play around with 30+ component 3DVA.
4 Likes
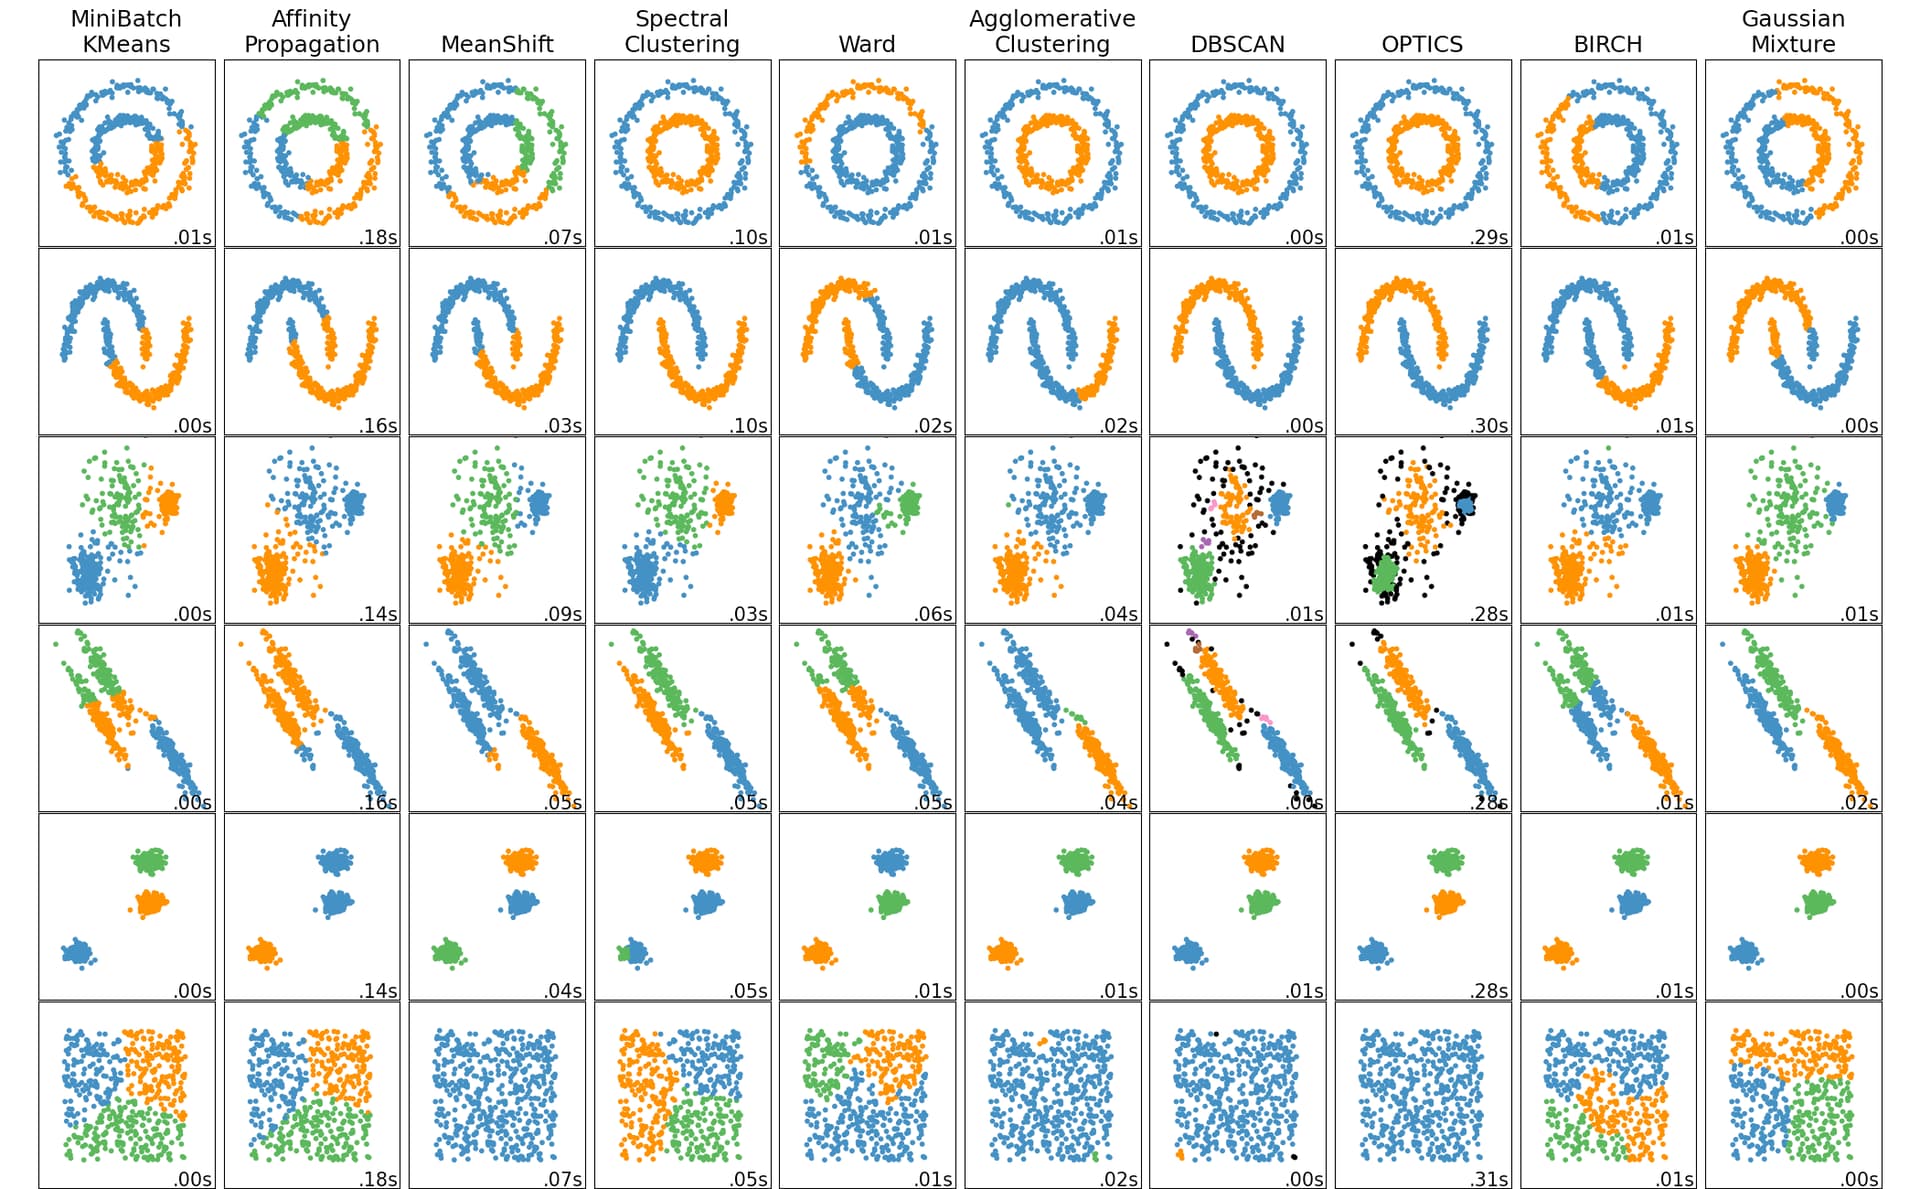
This is what I’m talking about (from sklearn.clustering documentation). GMM isn’t bad for all the 3DVA data I’ve seen (given k) but you can see what I mean about OPTICS being neat (black points are outliers with no cluster assignment, there is a parameter that controls how conservative it is).
3 Likes