Hello CryoSPARC world,
I am using template picker on a new workstation and the process seems to be running very slow. 2,000 micrographs in 12 hours. Is there a way to make sure if this is the optimal performance?
Thank you
Prash
Hello CryoSPARC world,
I am using template picker on a new workstation and the process seems to be running very slow. 2,000 micrographs in 12 hours. Is there a way to make sure if this is the optimal performance?
Thank you
Prash
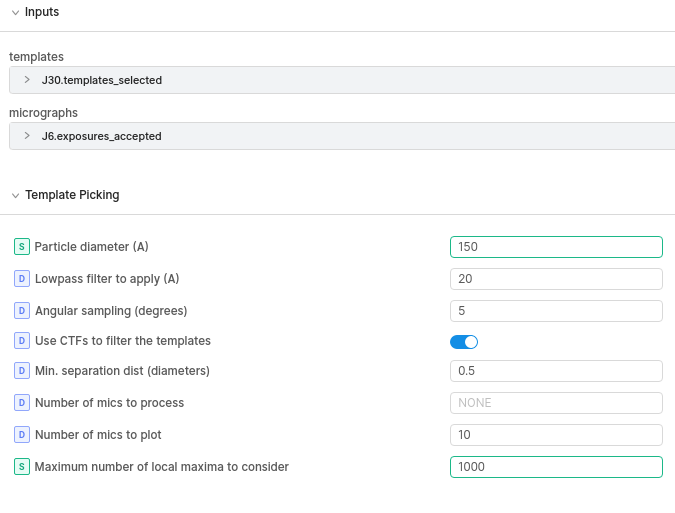
This is super slow. I would expect < 5s, often < 0.5s for 1000’s of particles per image, of course this depends on the images. How many templates are you using? I would suggest only 3 or 4, certainly not all good 2Ds from classification. Sorry, I can’t answer your question directly.
Thanks @CryoEM1, I was using more than needed templates. Picked the wrong input. It is working fine now.
Thank you again
Prash
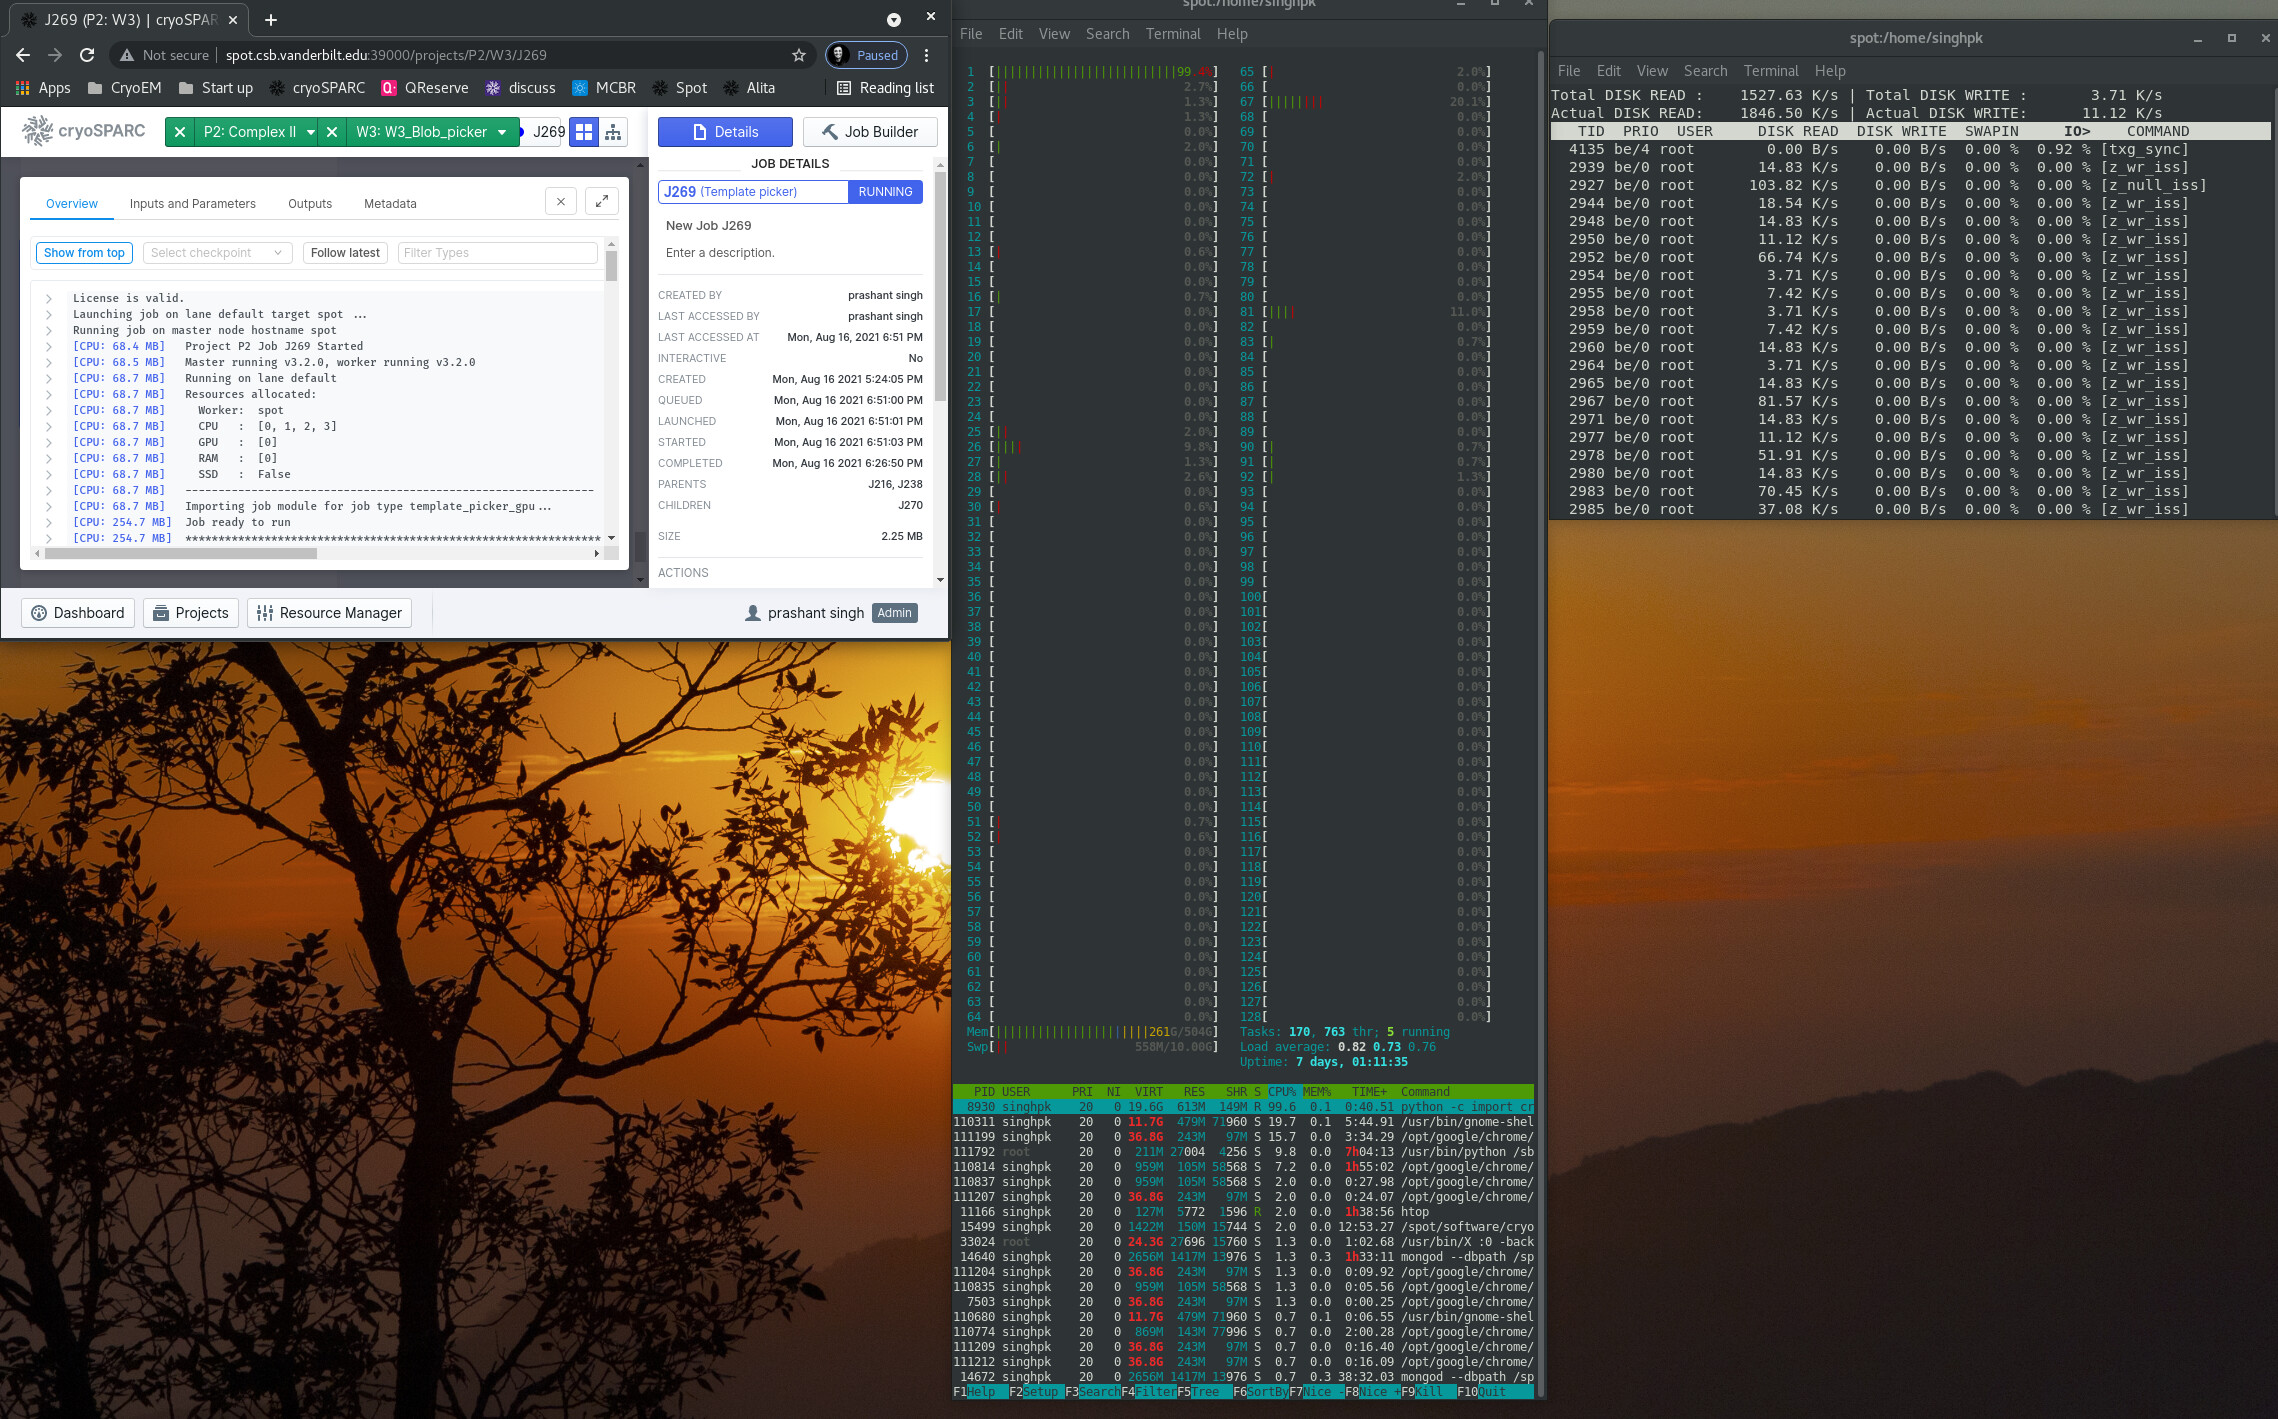
There still seems something wrong here. each micrograph is being processed in 1.7 sec and the GPU load is only 1-5% (based on nvidia-smi) and only one CPU core is being used. Also I would like to add the the program crashed on the previous attempt after 2 hours with error “no heartbeat for 30 sec”. The workstation is a new one with AMD threadripper pro 120 core and RTX 3090. Not sure is that has to do with the slow processing. Similar job on other workstation seems to go much faster.
Hi @prash, once the micrographs are on the GPU, template picker runs very very quickly. This means that GPU activity spikes and immediately goes back down. This brief spike may not show up in nvidia-smi, so that’s likely while you’re seeing low usage.
By far the biggest bottleneck for template picking is disk I/O; i.e., loading the micrographs into memory. That’s what I think is causing this slowdown. Do you have any I/O related monitoring such as from iotop? What does it report while the template picker job is running?
Hi @nfrasser,
Apologies for the delayed response. When running the template picker the read/write speed is:
total read speed: 166 Mb/s
actual read speed: 83 Mb/s
The data is stored on SSD.
Thank you
Prash
@prash could you also check to see if any CPU cores are running at 100% while the job is running? That may be affecting the read speed.
Sorry to latch onto this thread, but I am having a similar problem. In our case, we have four machines including a master and three worker nodes. When I launch a template picker job on the master, it runs normally (1-1.5 seconds per micrograph). When I launch the same job on any of the worker nodes (which have identical or similar hardware to the master), it is much slower (30-60 seconds per micrograph or even slower). I see from this thread that I can pick just a few template views, but even so the job runs at 6 seconds/micrograph on the worker nodes.
The data actually resides on one of the worker nodes. I don’t see any CPU saturation on any of the nodes.
I recently saw the same problem with a lab cryoSPARC instance: Template Picker jobs were now taking a whole lot longer (two-three days for some jobs, ~40-50sec/MRC), and the cryoSPARC worker python process seemed to only be using 100% of a single CPU thread. Each worker node was identical, running CentOS 7 with 192GB RAM, 24C/48T CPU, 2x RTX 2080 Ti.
After much testing, it ended up being CUDA. The worker nodes use the NVIDIA CUDA repos, and had CUDA 10.2 and 11.4 installed, with 11.4 being the default. Running update-alternatives to switch the default to CUDA 10.2 and having cryosparcw rebuild PyCUDA appears to have resolved the issue, with template picking now averaging a second or less per MRC. I’m not sure what it is about CUDA 11.4, but using 10.2 should hopefully fix the issue.
@bmdennis thank you for the suggestion. I will try that.
Seconded here. I upgraded to CUDA 11.4 (on Ubuntu 20.04 with 4x 2080) and our template picker went from <1s/micrograph to >30s. Downgraded back to 11.3 and we’re flying again.
3rd this, just downgrade to 11.3 and it works.
Update: 11.5 seems to work fine, ~1s per micrograph, which is about my performance with 11.3