Hi all,
Reaching out to the community because I have been having streaky artifacts with a lot of separate datasets recently that have me kind of stumped. For a little bit of background: I have this issue with data collected on two different Krioses (each with a K3 camera). I work nearly exclusively with ribosomes on UltrAuFoil grids that I float my own amorphous carbon onto (one exception where the holey film was carbon instead of gold). My typical workflow jumps around between relion and cryosparc and I see issues regardless of software, but cryosparc provides a bit more visual feedback that I thought may be helpful to share here.
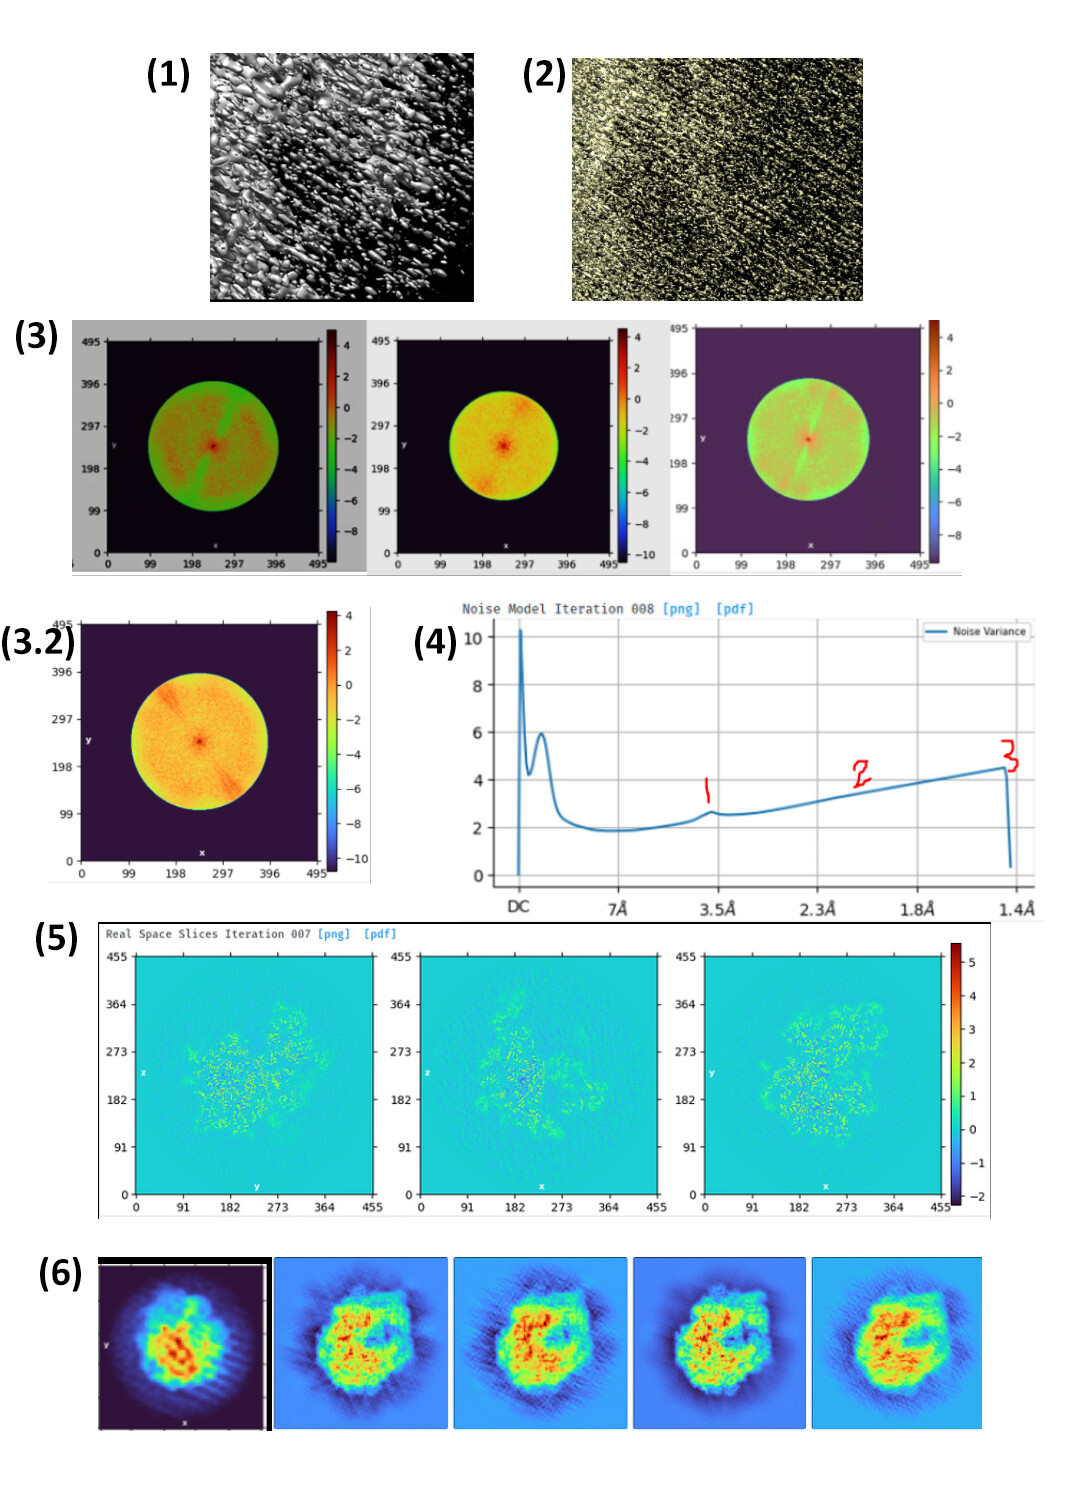
(I could only attach one image so I put a bunch in one file, here are details:)
(1) Example: CS-refined map around the edge of the ribosome into the solvent region, when I push the contour very low to where noise is prominent
(2) Unfiltered half-map from the same job (a bit more zoomed out)
(3) I notice I often get these features in the Fourier space slices: sometimes they are on the negative side of the spectrum, sometimes positive, sometimes areas of both (left, center, right). (some contrast adjustments applied to help bring it out. From different projects)
(3.2) Also, as you can see above it has almost always had a pretty consistent directionality. However, recently we had one that has changed direction
(4) The noise model: this also varies between datasets, where I usually see at least one of these 3 features: 1. a bump around ~3.5 Å (but there is some variation here), 2. a trend up instead of down (least common), and 3. a sort of “hook” at the end where the curve sharply turns down.
(5) During 3D refine jobs, there are noisy features in the region outside the ribosome that have a different “texture” in different planes. (this is from the final iter, going to 2.5 Å. Middle panel has different-looking noise, hope it is visible here)
(6) At the end I am generally seeing effects mostly at high resolution (as above), but sometimes intermediate steps with binned particles show lower-res striped patterns too (dark background, left: one slice from an ab initio job @ 4x bin; light background, right: 4 classes from a 3D hetero refine job @ 4x bin, where the 3rd contains particles I proceed with).
And some further comment:
We have had a couple cases where we suspected some contamination either from ice or possibly from the gold foil - in those cases we reject micrographs with strong high-res rings in the FFT but it isn’t always feasible to completely reject any hint of a ring. I know this isn’t ideal but I’d be a little surprised if this was the problem, given that in well-ordered map regions we clearly get many ribosome particles aligning very well to each other (base density really clear, many ions, solvation, etc. I am also generally putting these through ~4-6 rounds of classification between 2D and 3D). Plus I have at least one case where contamination was very minor.
If you have any thoughts or suggestions or questions about what all I have examined, I’d appreciate any help! I have tried reaching out to some others at my facility but no one I shared with seemed to be plagued with this the way I am. I have tried to keep this post focused on observation so as not to inundate you further with information on all the things I have checked. FWIW I typically get pretty believable global resolutions in the mid-low 2’s (as mentioned above). But for some of the weaker map features I am interested in this becomes a problem for interpretation in maps where it is really pronounced.