I wanted to ask about something that I’ve noticed happening between the stable v2.15, beta v2.16 and v3.0.1. I have been running v2.15 for quite a while, and it has been very fast and stable.
When I switched to beta v2.16, it suddenly got very slow (~2-3x slower performance during ab initio, heterogeneous refinement, homogeneous refinement, etc). So, I went back to v2.15.
Upon an update to v3.0.1, the same thing happened.
My setup is:
3x RTX 2080 Ti
192 GB RAM
AMD Ryzen Threadripper 2990WX
NVME 2TB scratch drive
Can you point to me what the issue could be? Just to add, this was an update, not a new installation. Could that be the reason?
It is almost as if the I/O operations are somehow much slower. I noticed that at first there might not be too much of a difference (still slower though); However, very quickly things slow down dramatically. The same extraction takes at least 5x longer. The same 2D classification that used to run very fast (30m), now takes over 3 hours.
I checked the file system, everything is working fine. I checked the GPUs, all is okay.
Seeing a similar phenomenon. As well as a strange increase in particle stack size. I have a stack that went from 100Gb in 2.15 to 2.2Tb in 3.0 and hence could not use the SSD.
Of note, I have not installed Cuda 11 separately. So, nvcc --version reports version 10.2. Afaik, CS3 added support for CUDA 11 - and here I do not know if CS3 is not defaulting to CUDA11, and in turn running in some compatibility mode, that could be slowing it down.
What do you think? That line of thinking could be a massive stretch.
There must be something in common with your systems if you’re all noticing a performance hit that we haven’t encountered in our testing.
Is it possible if you can provide the following information:
Run the command lscpu && free -g && uname -a and paste the output here
For a job where you noticed this slowdown, copy the contents of the streamlog here by running the following commands in the interactive shell:
cryosparcm icli
project_uid = <project_uid of job> #replace this value e.g. "P12"
job_uid = <job_uid of job> #replace this value e.g. "J12"
all_text_events = list(db.events.find({'project_uid':project_uid, 'job_uid':job_uid, 'type':'text'}, {'_id':0, 'created_at':1, 'text':1}))
streamlog_path_abs = '{}_{}_streamlog.log'.format(project_uid ,job_uid)
with open(streamlog_path_abs, 'w') as openfile:
    for event in all_text_events:
        openfile.write("%s  %s\n"%(str(event['created_at']), event['text'].strip('\n')))
This will write out the stream log for the job in your current working directory, which you can paste here or send to feedback@structura.bio (if you’d to share this file confidentially)
@stephan, I also encountered those phenomenon, as the 2D and 3D all became very slow compared with previous version 2.15.0 private beta~
And also I can import my previous projects, but the workspaces are almost empty, only very little jobs showed~Below is the output of your 1st command:
lscpu && free -g && uname -a
Architecture:          x86_64
CPU op-mode(s):        32-bit, 64-bit
Byte Order:            Little Endian
CPU(s):                80
On-line CPU(s) list:   0-79
Thread(s) per core:    2
Core(s) per socket:    20
Socket(s):             2
NUMA node(s):          2
Vendor ID:             GenuineIntel
CPU family:            6
Model:                 85
Model name:            Intel(R) Xeon(R) Gold 6230 CPU @ 2.10GHz
Stepping:              7
CPU MHz:               2101.000
CPU max MHz:           2101.0000
CPU min MHz:           800.0000
BogoMIPS:              4200.00
Virtualization:        VT-x
L1d cache:             32K
L1i cache:             32K
L2 cache:              1024K
L3 cache:              28160K
NUMA node0 CPU(s):     0-19,40-59
NUMA node1 CPU(s):     20-39,60-79
Flags:                 fpu vme de pse tsc msr pae mce cx8 apic sep mtrr pge mca cmov pat pse36 clflush dts acpi mmx fxsr sse sse2 ss ht tm pbe syscall nx pdpe1gb rdtscp lm constant_tsc art arch_perfmon pebs bts rep_good nopl xtopology nonstop_tsc aperfmperf eagerfpu pni pclmulqdq dtes64 monitor ds_cpl vmx smx est tm2 ssse3 fma cx16 xtpr pdcm pcid dca sse4_1 sse4_2 x2apic movbe popcnt tsc_deadline_timer aes xsave avx f16c rdrand lahf_lm abm 3dnowprefetch epb cat_l3 cdp_l3 invpcid_single intel_pt spec_ctrl ibpb_support tpr_shadow vnmi flexpriority ept vpid fsgsbase tsc_adjust bmi1 hle avx2 smep bmi2 erms invpcid rtm cqm mpx rdt_a avx512f avx512dq rdseed adx clflushopt clwb avx512cd avx512bw avx512vl xsaveopt xsavec xgetbv1 cqm_llc cqm_occup_llc cqm_mbm_total cqm_mbm_local dtherm ida arat pln pts
              total        used        free      shared  buff/cache   available
Mem:            376          41           7           0         327         331
Swap:            11           0          11
Linux node112 3.10.0-693.11.6.el7.x86_64 #1 SMP Thu Jan 4 01:06:37 UTC 2018 x86_64 x86_64 x86_64 GNU/Linux
I noticed that the installation instruction mentioned: to ensure use the lastest version of NVIDIA Driver compatible with your GPU and CUDA Toolkit, I am not sure if this is essential for CS3.0.1
The cryoSPARC worker node requires CUDA to be installed alongside an NVIDIA GPU. CUDA is a parallel computing platform and programming model developed by NVIDIA for general computing on its own GPUs.
Thanks for your response. I installed the newest drivers and changed to the newest Cuda version. For a while, it ran okay, but occasionally it “chokes”.
I ran:
lscpu && free -g && uname -a
Architecture: x86_64
CPU op-mode(s): 32-bit, 64-bit
Byte Order: Little Endian
CPU(s): 64
On-line CPU(s) list: 0-63
Thread(s) per core: 2
Core(s) per socket: 32
Socket(s): 1
NUMA node(s): 4
Vendor ID: AuthenticAMD
CPU family: 23
Model: 8
Model name: AMD Ryzen Threadripper 2990WX 32-Core Processor
Stepping: 2
CPU MHz: 1919.792
CPU max MHz: 3000.0000
CPU min MHz: 2200.0000
BogoMIPS: 5987.73
Virtualization: AMD-V
L1d cache: 32K
L1i cache: 64K
L2 cache: 512K
L3 cache: 8192K
NUMA node0 CPU(s): 0-7,32-39
NUMA node1 CPU(s): 16-23,48-55
NUMA node2 CPU(s): 8-15,40-47
NUMA node3 CPU(s): 24-31,56-63
Flags: fpu vme de pse tsc msr pae mce cx8 apic sep mtrr pge mca cmov pat pse36 clflush mmx fxsr sse sse2 ht syscall nx mmxext fxsr_opt pdpe1gb rdtscp lm constant_tsc rep_good nopl nonstop_tsc cpuid extd_apicid amd_dcm aperfmperf pni pclmulqdq monitor ssse3 fma cx16 sse4_1 sse4_2 movbe popcnt aes xsave avx f16c rdrand lahf_lm cmp_legacy svm extapic cr8_legacy abm sse4a misalignsse 3dnowprefetch osvw skinit wdt tce topoext perfctr_core perfctr_nb bpext perfctr_llc mwaitx cpb hw_pstate sme ssbd sev ibpb vmmcall fsgsbase bmi1 avx2 smep bmi2 rdseed adx smap clflushopt sha_ni xsaveopt xsavec xgetbv1 xsaves clzero irperf xsaveerptr arat npt lbrv svm_lock nrip_save tsc_scale vmcb_clean flushbyasid decodeassists pausefilter pfthreshold avic v_vmsave_vmload vgif overflow_recov succor smca
total used free shared buff/cache available
Mem: 125 14 3 3 107 106
Swap: 3 3 0
Linux jptitan 4.18.0-193.19.1.el8_2.x86_64 #1 SMP Mon Sep 14 14:37:00 UTC 2020 x86_64 x86_64 x86_64 GNU/Linux
I don’t quite understand the 3 processes associated with this, as it is running on just 1 GPU (GPU 0).
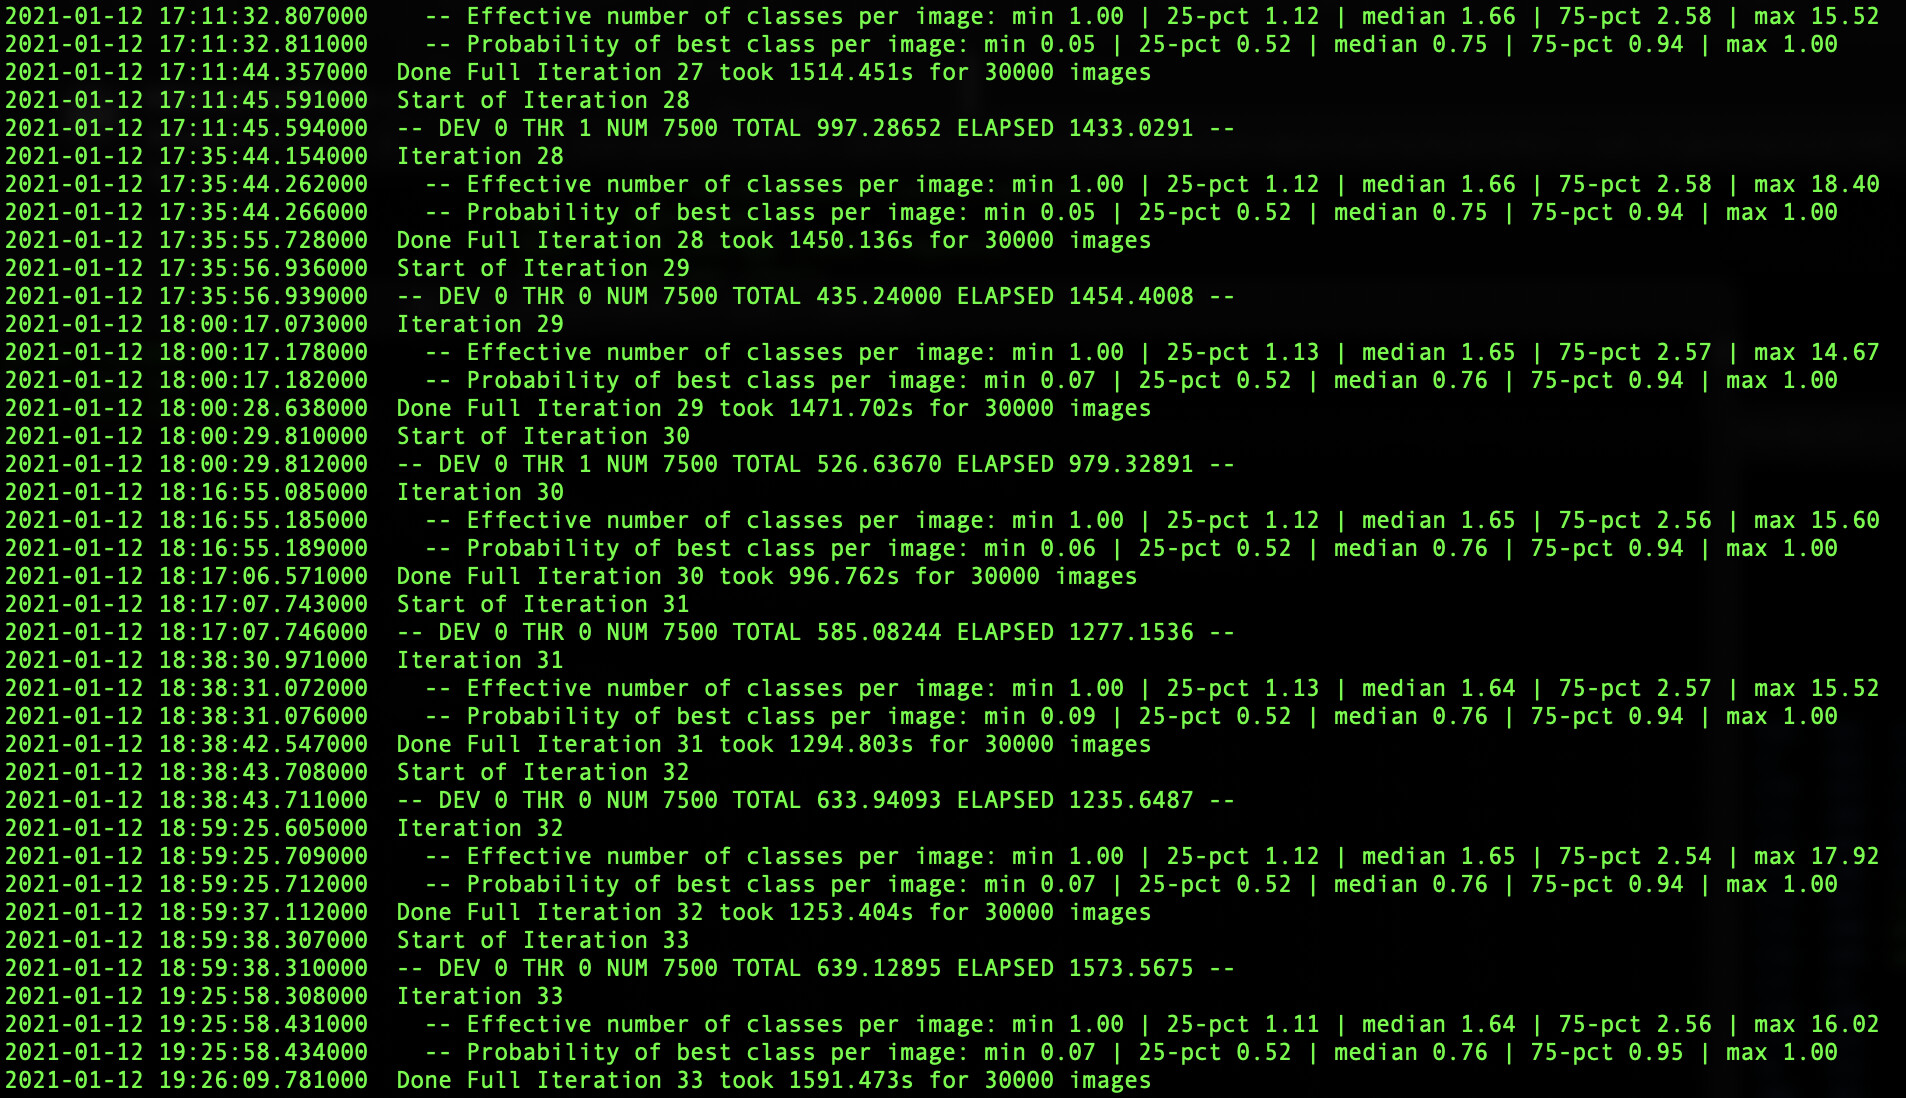
Another thing that I did was to do what you suggested, get the job log.
I made a screenshot, since I cannot seem to find the button to attach text files:
Hi everyone, we made some fixes to cryoSPARC’s SSD caching system that should address these performance issues you’ve observed. Please update to the latest cryoSPARC v3.1 and let me know if you run into further performance issues.
Hi @nfrasser.
The performance improved, but it is quite obvious that when two processes try to access the same resources, it slows to a halt. Since you referenced the SSD caching, I have been paying closer attention to this, and it does seem that the reading in of images is slow as heck if two processes are trying to read the cache in.
Is there anything that could be done about it? In 2.15, this was never an issue.
Hi @jparmache_psu, thanks for the detailed reports. We’d really like to get to the bottom of this.
A couple of clarification questions:
Does this mean that the other machines with CUDA 11 and CS3 did not have any performance issues at all and run as fast as 2.15? Can you tell us which OS they are running?
In this case, you mean that if two jobs are running simultaneously using the same particle data, they both get a lot slower when reading from the cache? (or do you mean when filling up the cache initially?)
Pardon the delay. That’s probably the most used up statement in the past year
Sort of. It works much faster in general. But they will head to a halt in a particular situation.
(Both run CentOS 8).
Two jobs that are started, even independently, will slow down and not during the cache filling. When the data is already in cache, if two processes try to access data there, they both essentially stop going forward (they do go proceed, but at 1-10% of the normal speed). Killing both jobs, and restarting only one makes the one job work at normal speed.
I believe that even when accessing two different folders in cache, it is very slow.