I didn’t understand a sharp drop in fsc curve in in 3D refinement (NU refine)
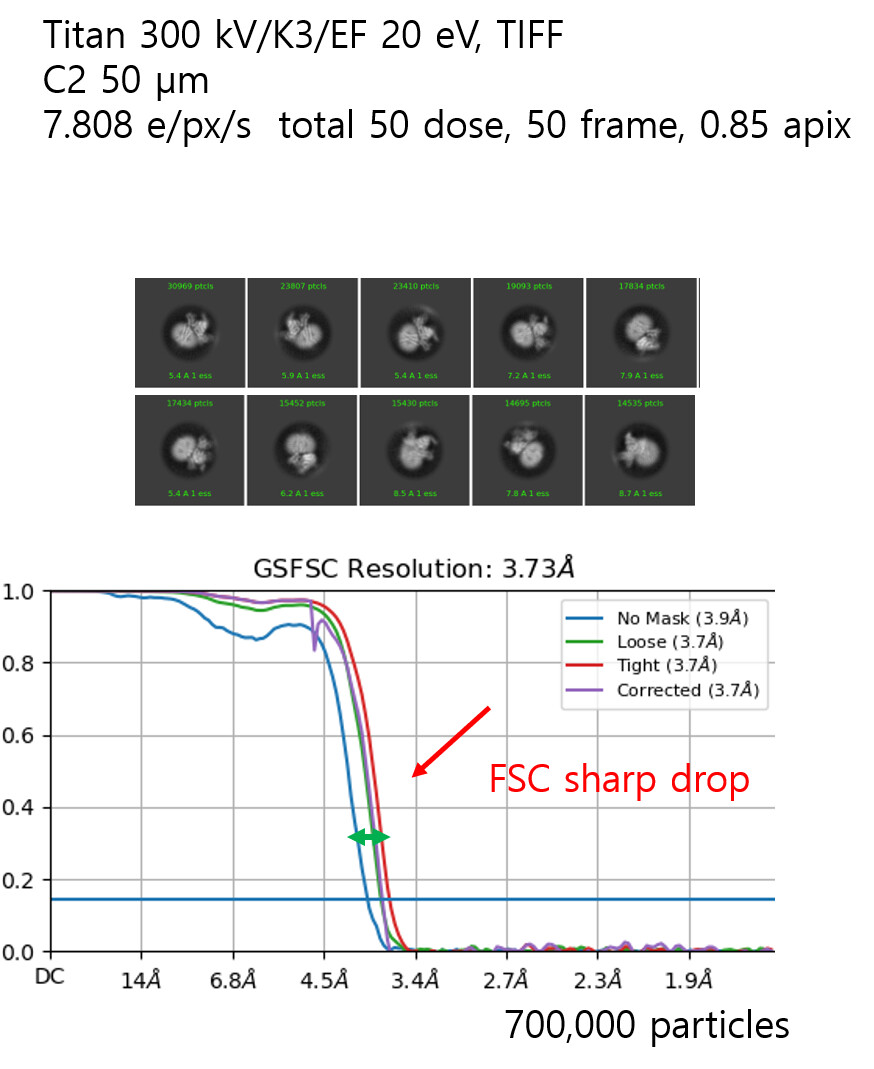
This resolution drop was shown in three different (but all membrane proteins) samples repeatably on Titan Krios K3, tiff movies, EF 20 eV
However,
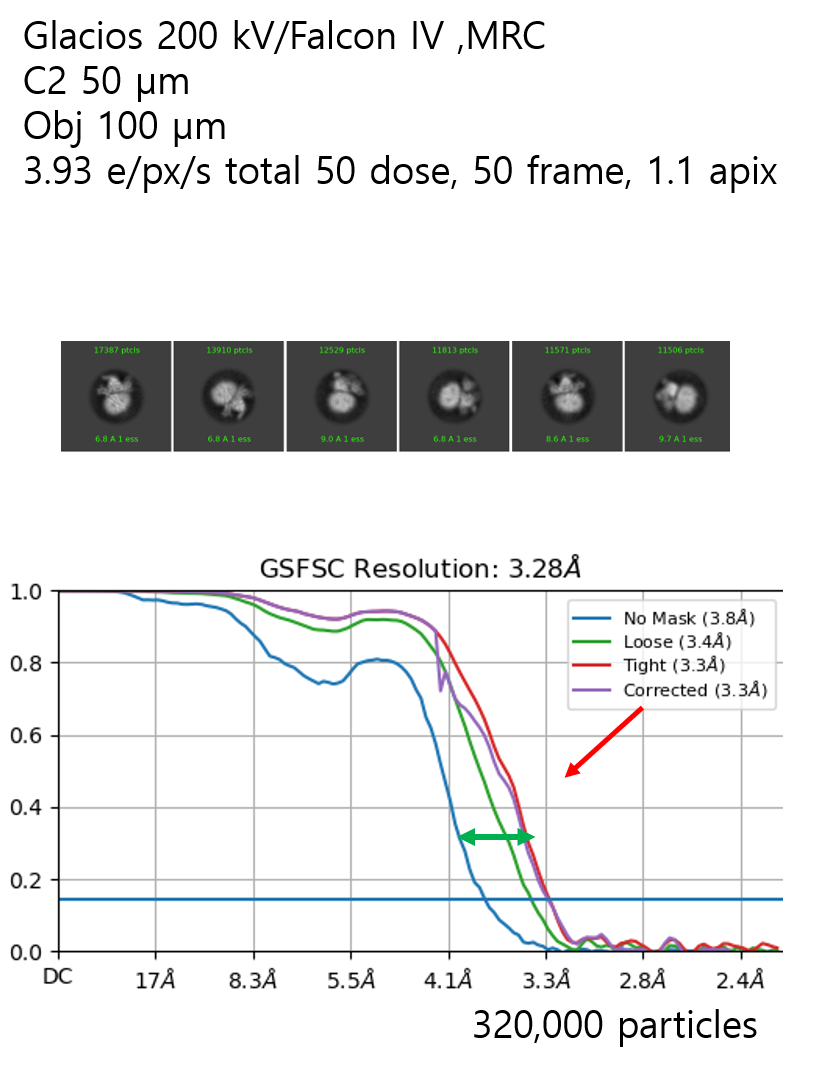
Before data collection on Titan, I always screened the same samples (but different grid) on Glacios, Falcon IV, MRC. It showed common, good feature of fsc and signals in each three samples.
Here, the same samples from Glacios corresponding to the above data set
Have you checked for beam tilt issues? When we see this kind of vertical drop in the FSC (in masked & unmasked) it often indicates that beam tilt is a limiting factor. Try refining global CTF parameters and see if that helps?
yes, their x-axis scales are different due to different apix (1.1A, 0.85A) so, this makes the sharp drop seem a little exaggerated.
But, the absolute value of no mask and corrected curve are sharp signal loss still…
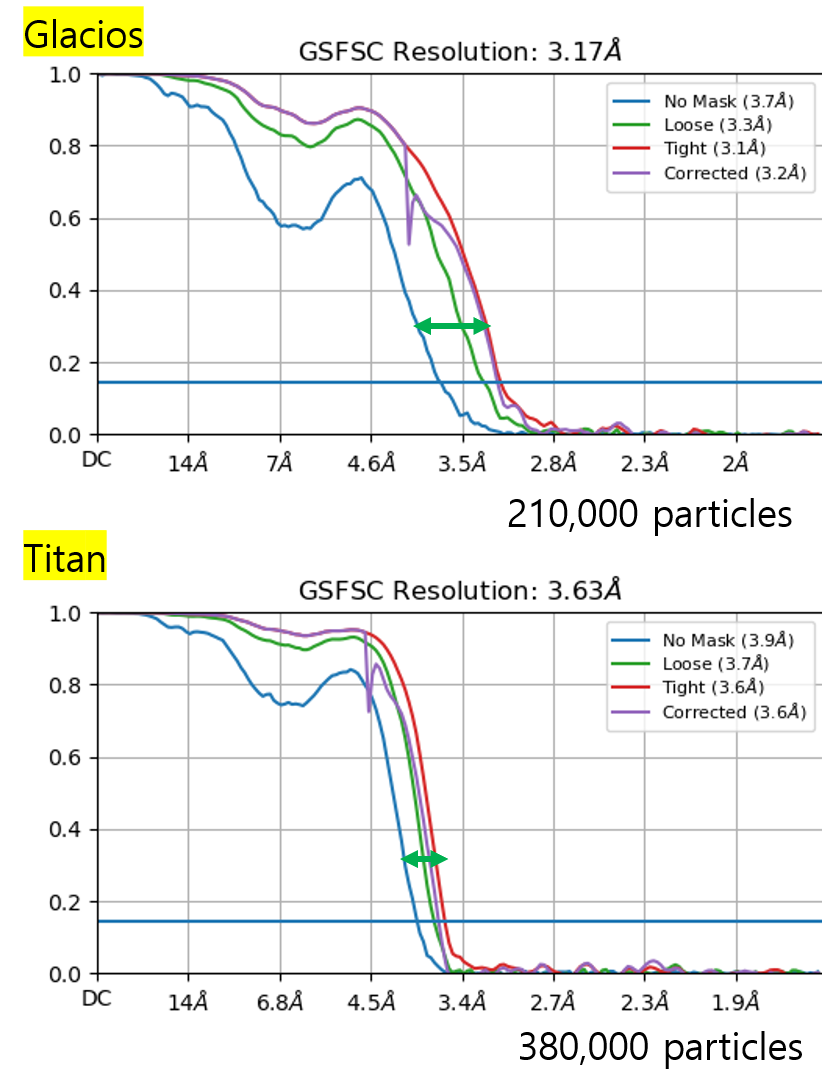
Here are another one of the three kinds of my data I collected (almost same apix, same sample batch, same grid preparations, same processing)
That’s a great point. In fact, I’ve tried some things like beam-tilt refinement (also, tried other CTF refine), further classification with cryoSPARC and RELION, local Motion Correction, polishing, and new picking… but, It didn’t show improvement on a vertical drop in the FSC and resolution limit compared to the Glacios data.
It seems like the signal after a certain frequency (~3.5 A) is dead…
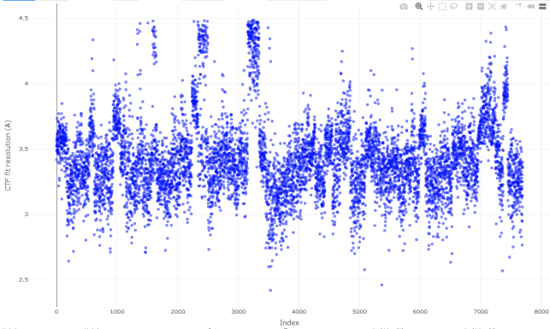
This Titan Krios data ctf-fit distribution is like this
It may simply be the limit of the particle qualities, but similar results were obtained for all three different sample collections (also all Glacios/Falcon IV data showed normal features).
The other posts you wrote on the cryoSPARC Discuss were very helpful! I got a lot of help. Thank you.
In fact, the box size of the Glacios data set is 300 pix (1.1 apix) and the Titan data set is 400 pix (0.85 apix). The dimension of my protein (GPCR-G protein complex) is about 100 ~120 A.
I think that these box sizes are about 3x larger than particles so, enough to apply CTF signals. You mean the new box size for Krios dataset, for example, ~512 box size?
Also, the masks of two data are automatically generated by NU refinement in cryoSPARC. I’ll simpely test the NU refinement with more soft mask and new box