Hi cryosparcteam,
I find a small problem that the 3D fsc job’s plot didn’t show the S.Dline(green line).
ruirui
Hi cryosparcteam,
I find a small problem that the 3D fsc job’s plot didn’t show the S.Dline(green line).
ruirui
Hi @wonderful,
Thanks for reporting this, I’ve added it to our issue tracker. It looks like this information isn’t available elsewhere in the job outputs, so we’ll try to get this fixed in a future release.
Best,
Michael
Hi all, wondering if there is any solution for this yet. I looked through job outputs but seems like it’s still an ongoing issue?
Hi @sjcalise, good timing! I’m happy to report that we do have an updated version of the 3DFSC job that will fix this in an upcoming release :).
Glad to hear it Valentin! See also this thread in case there is any room for additional updates/fixes ![]()
Hey @olibclarke, @wonderful,
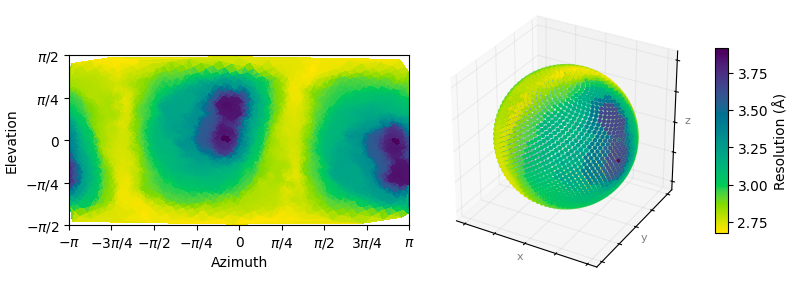
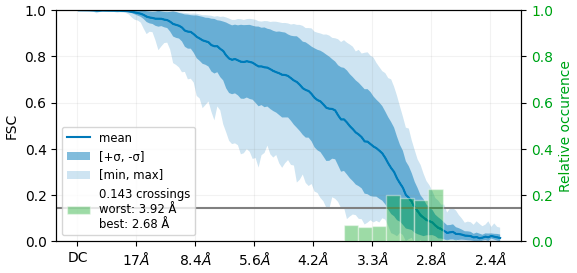
v4.4 now includes a new Orientation Diagnostics job which outputs a 3DFSC-like plot,
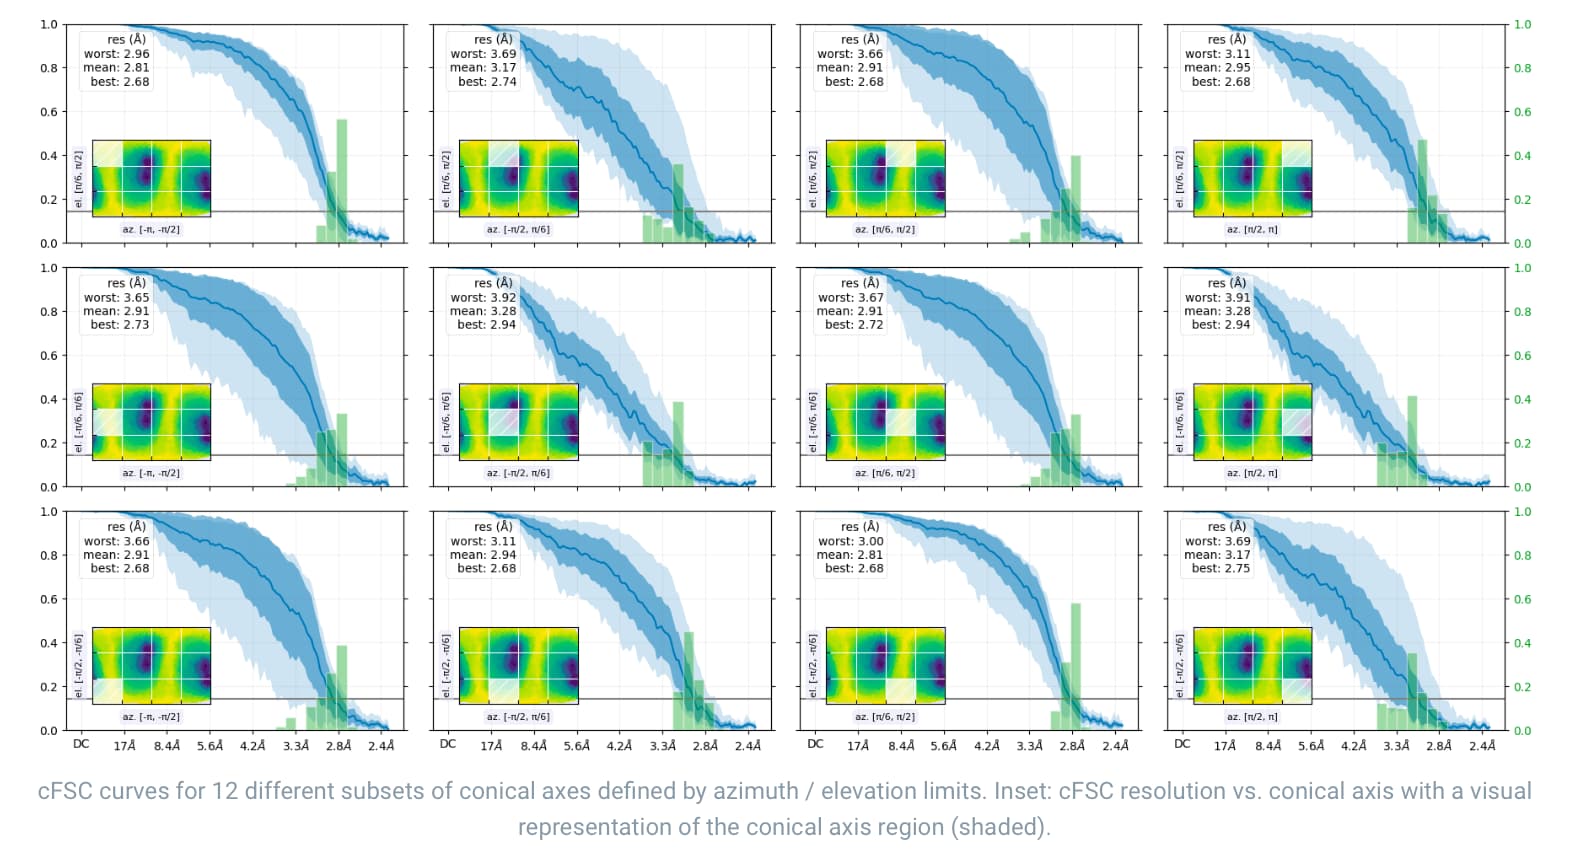
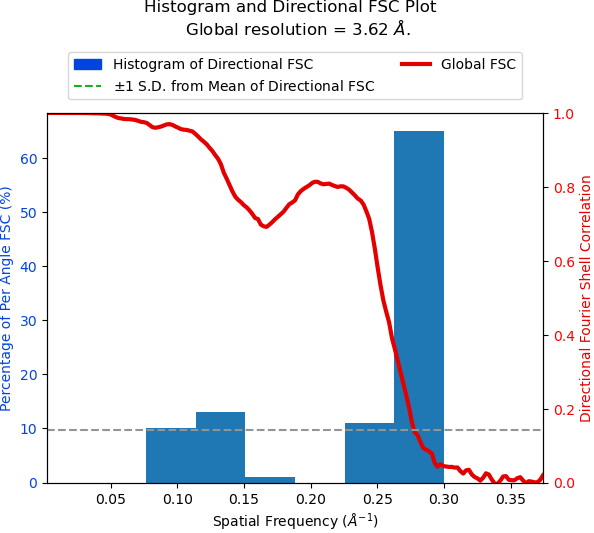
and several directional FSC plots like,
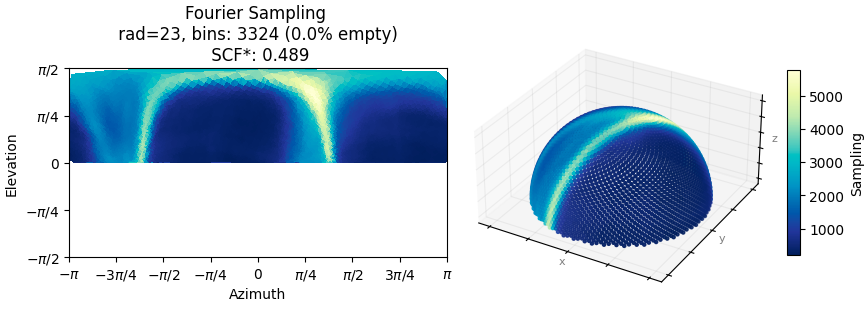
and finally a Fourier sampling plot (computing a ‘Sampling Compensation Factor’ introduced by Baldwin & Lyumkis):
.We wrote up a quick tutorial with tilted and untilted HA Trimer data. The tutorial & guide has some extensive information regarding SCF and a new metric we came up with called ‘conical FSC area ratio’ (cFAR).
Hopefully this is useful! Appreciate any feedback you might have on the job and the utility of the metrics!
Valentin
I saw, looks great, this is exactly what I was after!! Going to test it out shortly. Thanks for this phenomenal update ![]()
For this part (which is already great!):
It might be nice to add a projection of a downsampled map along the conical axis direction as an insert to each sub-plot - this would allow the user to directly & quickly visualize which directions are “good” or bad with respect to the overall molecular envelope.
Cheers
Oli
Ah we thought about that! It gets quite confusing however because a poor FSC along a certain conical axis doesn’t mean a projection along that axis will look poor (since slices contribute to Fourier pixels which are orthogonal to the viewing direction) – e.g., a dataset full of mostly T20S ‘top views’ will result in very poor FSCs along the vertical conical axis, but projections along that top viewing direction will show the nice D7 symmetry you’d see in the 2D averages.
I had a brief discussion with Dmitry Lyumkis about this at EMBO in London – perhaps there might be a clever way to report ‘best views to add’ (a la best tilt angle for sample collection, but more general) by mapping conical axes with poor FSC (considering 3D shape / symmetry) to missing viewing directions. No progress on this yet though (from our end).
I don’t mean so much the visual appearance of the projection - more as a quick visual aid to tell the user which direction on the plot corresponds to which view in real space (e.g. what is a top and what is a side view). This is usually obvious in Cn symmetry, but may not be as clear in C1
I like the idea of calculating the best views to add! With a large enough dataset, could the data here be used for rebalancing the orientations (in a more sophisiticated way than rebalance 2D)?
Got it! In that case, maybe we can generate a separate figure for this to not overwhelm/complicate this one. Thanks – recorded!
EDIT:
Yes, I think so. We already have something in the pipeline that uses an existing 3D reference to identify good 2D classes. We could look at augmenting our notion of ‘good’ to also consider directional FSC information. Will ponder!
Re this:
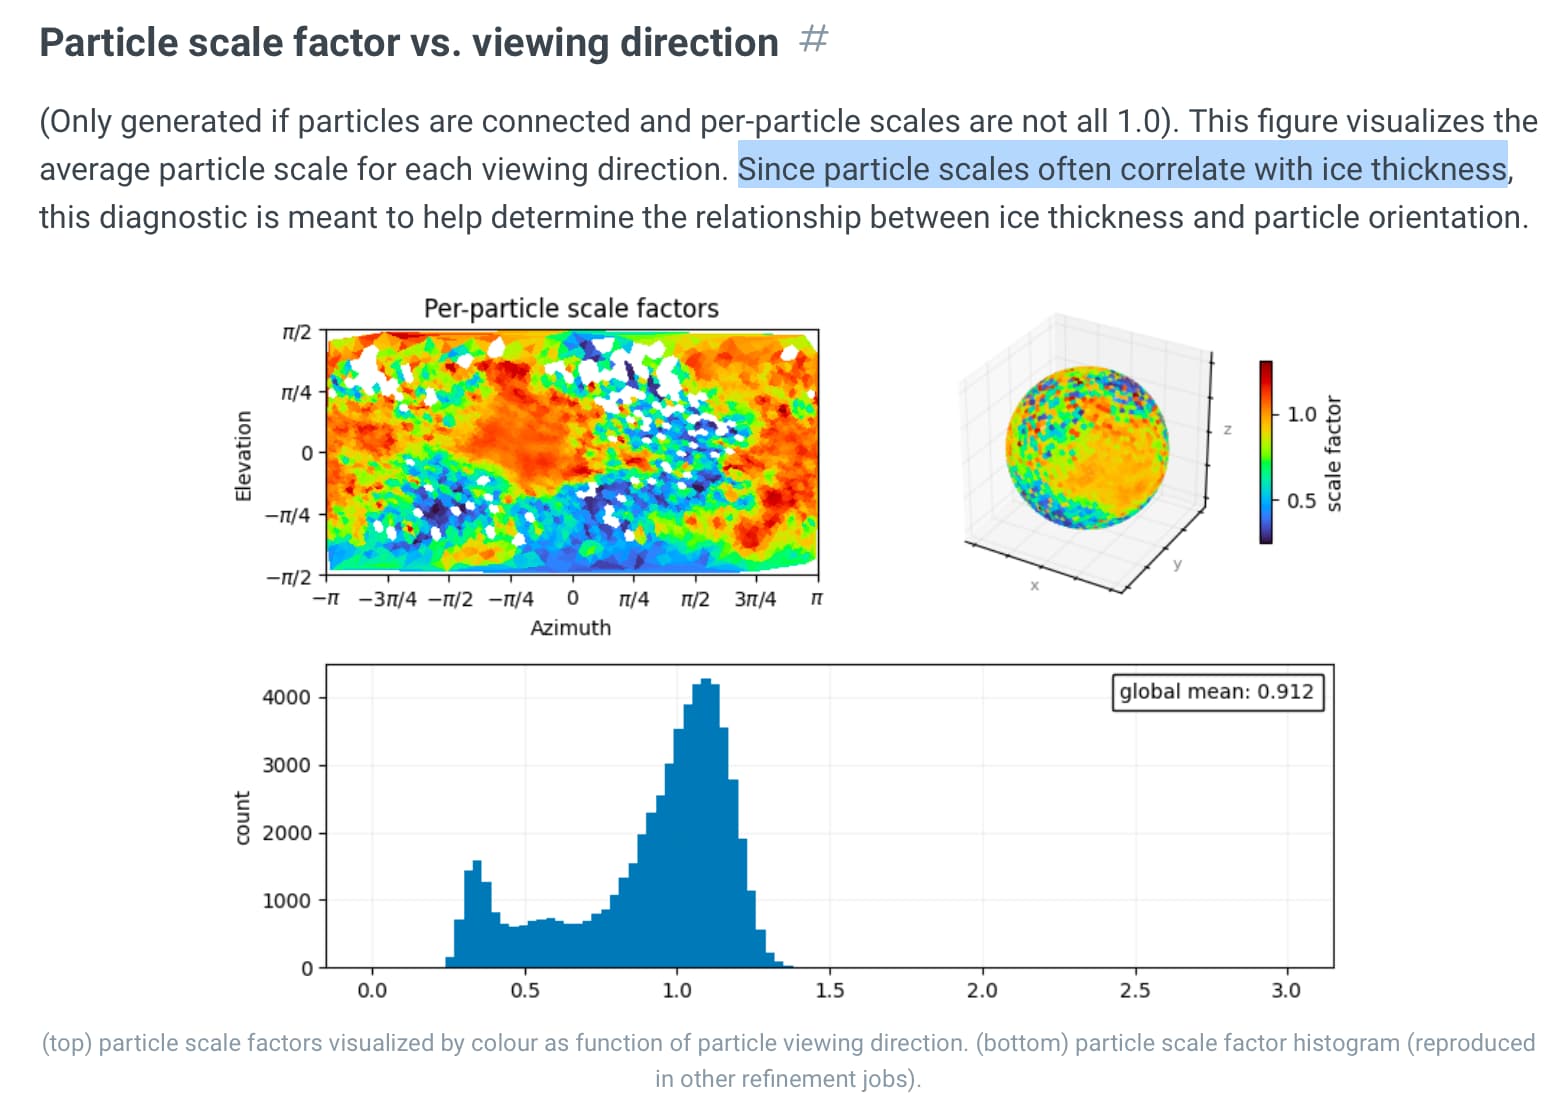
Is there any quantitative data on this? E.g. if you plot average particle scale factor per micrograph vs relative ice thickness, do you get anything useful that could inform data collection strategy?
Is it the ice or is it intrinsic to the views?
I imagine it depends on the particle shape & ice thickness… e.g. for a long rod-shaped particle, I would expect the scale factor to be different for the views along & orthogonal to the rod axis, even if both are in ice of the same thickness - but maybe I am interpreting it incorrectly?
No, there isn’t anything concrete. The note here was more of a hypothesis rather than a definitive statement. After some internal discussion, we’ve now removed it from the job page to avoid any potential confusion.
If you do find a situation where this plot reveals something useful, please let us know!