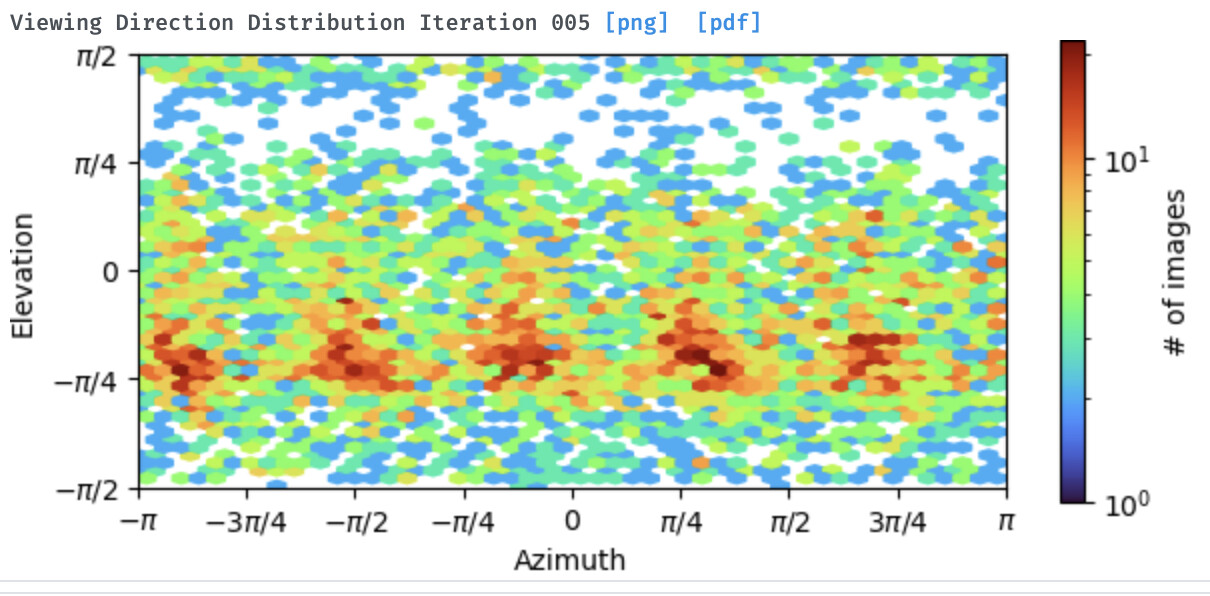
Would it be possible to plot the directional FSC based resolution values from the raw conical FSC calculations on a Mercator-style “map of the world” plot, as is done in the refinement log for the orientation distribution?
For me this would be a much more digestible way of displaying this information, and allows one to easily see e.g. that the resolution is poorer in side than top views for example.
This would involve plotting the elevation & azimuth of the conical FSC, and then coloring by resolution in this direction.
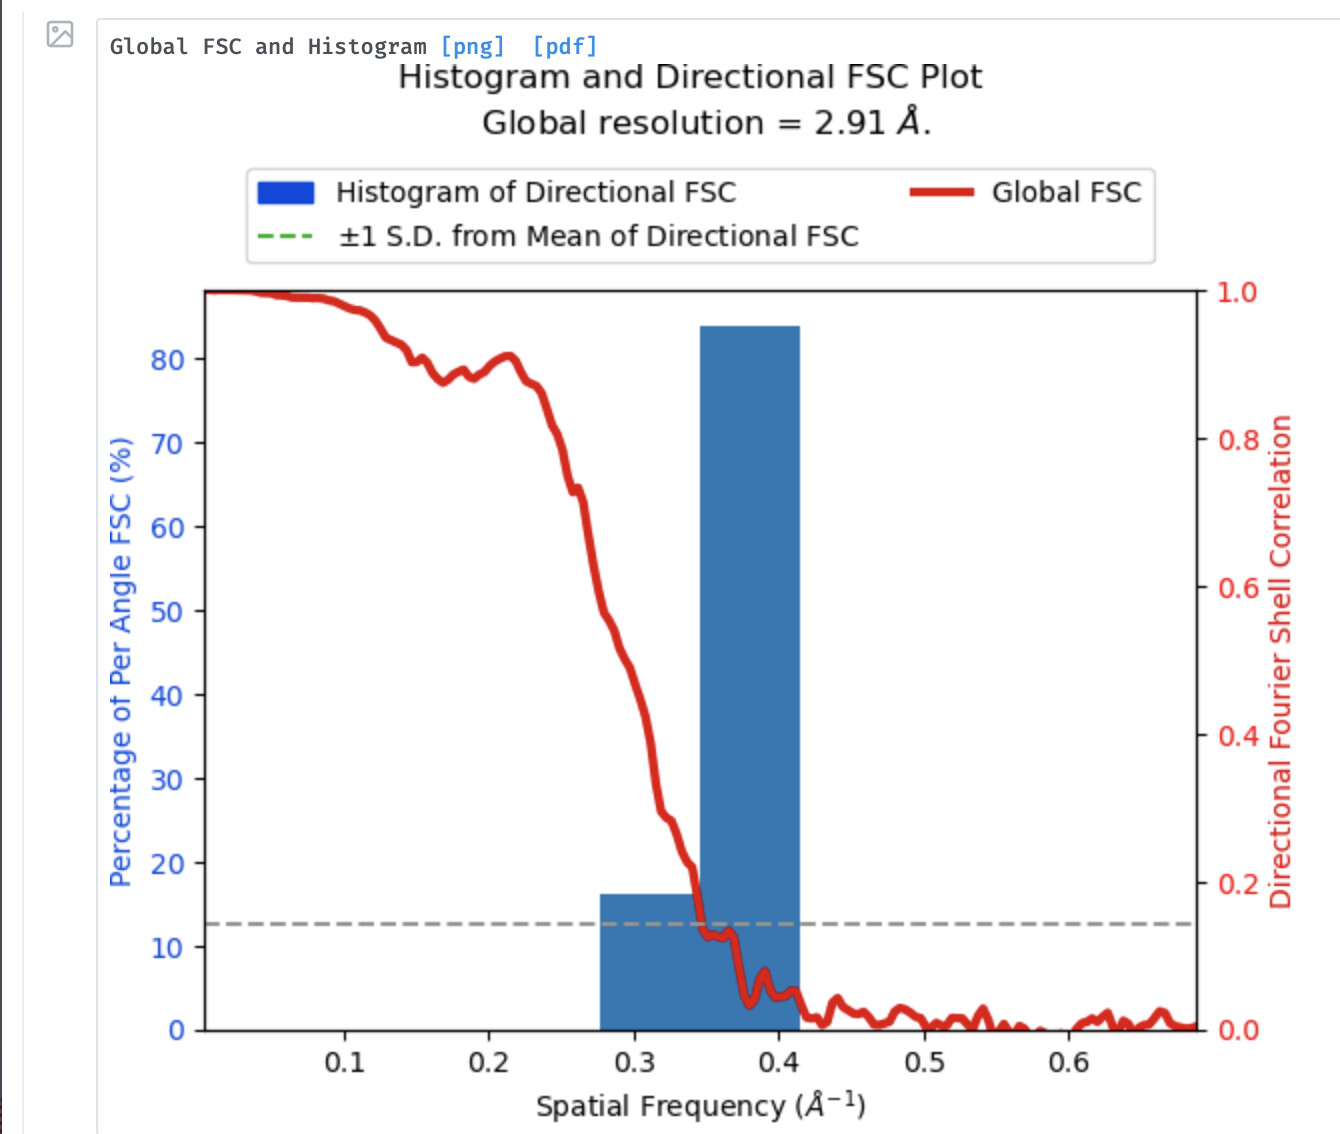
Also, currently 3D-FSC says it plots the +/- 1SD range of directional FSCs on the output plot, but it does not - the legend is there but nothing on the plot. It would be useful if it did, and also output to the log the values of the +1SD and -1SD directional FSC resolutions. These could then be quoted as a range for reporting in a paper, for example.
It would also be helpful if an example individual directional FSC curve was included in the output, to allow the user to evaluate if the chosen FSC threshold is appropriate. The default in cryosparc is 0.143, I think if I recall right the default threshold in the original 3D-FSC code was 0.5, but I could be misremembering