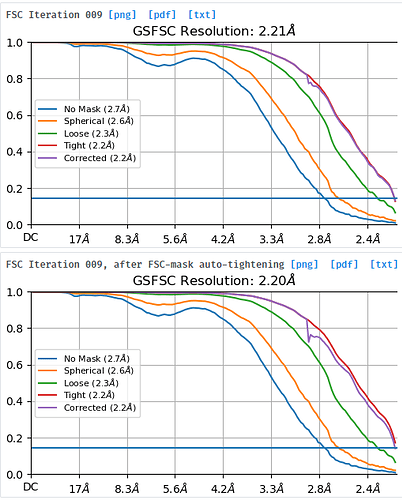
Hi, everyone. I used more than one million particles to do the non-uniform refinement. The pixel size was 1.087 A. And The final resolution was 2.2A, which seems to the limitation. I am afraid it is fake. Another detail was that the fsc curve was end above the 0.143. I didn’t know how to deal with it. I think maybe too many particles lead to the fake high resolution. I did not know how to deal with it in the publication.
Hi Yuqi,
What do you see in the sharpened map? Do you see features consistent with this resolution? It is ending above 0.143 because your resolution seems to be limited by your pixel size (sampling). There could be some issue, but do you have any reason to think it is “fake” other than that it is unexpectedly high?
For visualizing your map, I would recommend resampling on a finer grid. This will enable better visualization of higher resolution features (waters, cabonyls), which may look crunchy or spiky at the default sampling.
Cheers
Oli
Thanks for your fastest reply! The map was really good. However, the curve totally above the 0.143 seems like a bad thing. I did not know how to present it in my manuscript for publication. Another question was, if it reach the limitation, the resolution should be 2.17 A, maybe? So I think there can be something wrong here.
Thanks for your fastest reply! The map was really good. However, the curve totally above the 0.143 seems like a bad thing. I did not know how to present it in my manuscript for publication. Another question was, if it reach the limitation, the resolution should be 2.17 A, maybe? So I think there can be something wrong here.
Hi Yuqi,
Your resolution is very likely limited by sampling.
You can present it in a publication as is - your curve did not return below 0.143, because your resolution exceeded the limit set by the pixel size used in your data collection.
I know what you mean, it should report 2.174 rather than 2.2 - this is a quirk of cryoSPARC, it always happens with FSC curves hitting Nyquist (they report a resolution just below the theoretical Nyquist), I am not entirely sure why, perhaps @team can explain?
Cheers
Oli
Thank you very much! I can be happier cryosparc team can answer the question and give me more details about this?
If you still have your movies, you can rerun motion correction with a Fourier cropping factor of 1.5 or 1. You will get a more interpretable FSC curve, and your resolution may go beyond physical Nyquist.
(More interpretable in that there will be a true FSC=0.143 resolution, now you can only say the 0.143 resolutionb with a tight mask is < 2.2).
wait what? You can do that, even without super-res data…? I didn’t realize Patch motion would allow interpolation to finer than physical pixel size!
Oh, I just assumed the movies would be super res, and @Yuqi’s 1.087 was 2x Fourier cropped to the physical Nyquist.
If you just interpolate to a finer grid I would imagine the FSC might be extended by spurious correlations. Like if you just set the volume size to 2x the real box size in a refinement, the reported resolution can be much higher, but I thought this was due to spurious correlations from interpolating. I’ve never used cryoSPARC motion correction, so I don’t know what parameters it will accept.
Yeah that’s why I was surprised haha - I wouldn’t necessarily assume that it was collected in super res - we don’t collect with super res by default here unless we have a reason to expect we will need it. The slower motion correction and larger storage requirements for raw data get to be a problem for large datasets.
and yes agreed I definitely wouldn’t just trust a refinement that is interpolated to larger box. But post refinement, interpolating to a finer pixel size can give much better detail in cases like this, particularly for waters & carbonyls, which can otherwise look crunchy if the resolution is near/at Nyquist.
Actually quite often when working with heavily binned particles early in processing I will do refinements in a larger box size - if binned to 4Å per pixel, interpolating to 2Å per pixel can give much nicer looking maps (and at that stage I only care about visualization & analysis more than the reported resolution)
Thank both of you! I have known about that.
Hi all,
To reply to the question about reported resolution: the reason why the theoretical Nyquist frequency 1/(2*pixel_size) isn’t reported as the resolution is because the final few Fourier shells (I believe the last 2) aren’t solved for interpolation & efficiency reasons. It’s a minor tradeoff we made during reconstruction, to allow for some more advanced signal-processing related details while minimizing computational cost. If you download the FSC text file, you’ll see exactly which wave numbers the structure & FSC are computed at. So the “true resolution” corresponding to the last Fourier shell present in the reconstruction is still what’s reported in the plots and text file.
In cryoSPARC there isn’t an easy way to get around this if you’ve already processed your data at the raw pixel size of the microscope. In practice though, this isn’t really a matter of map visual quality because it only affects 2 Fourier shells. It’s moreso a matter of the official resolution threshold, but as has been pointed out in the literature, FSC-based resolution metrics already have a bit of a disputed interpretation and can be biased by things such as the mask.
Best,
Michael
