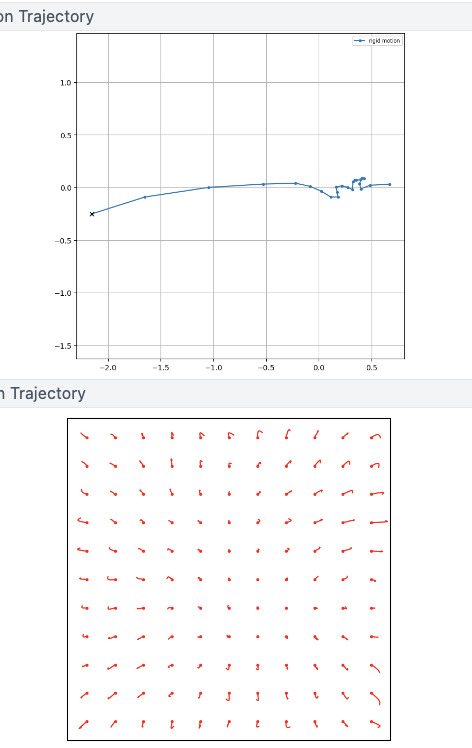
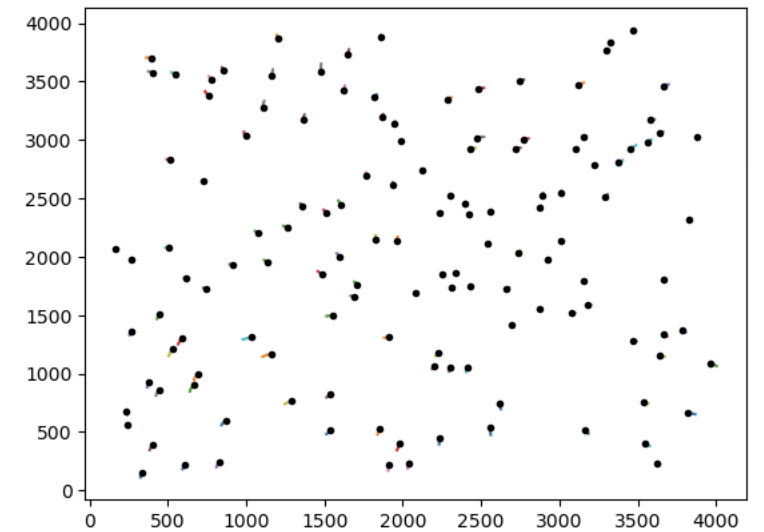
The hyperparameter estimation seemed to work according to plots, empirical doseweighting looks good, but for all 20 motion plots there is no motion, just black dots. NU-refinement suggests degradation, 3.2Å instead of 2.8Å input. Job runs normally still with other data, and this failed job takes a normal amount of time.
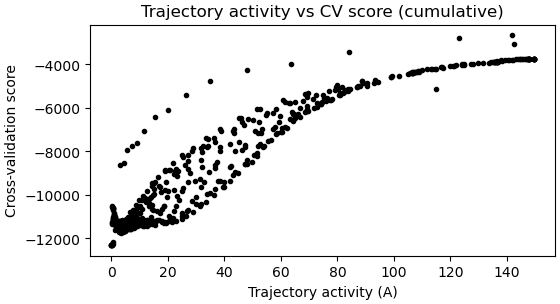
Hi @CryoEM2, we have seen this occasionally happen. On some datasets, the cross-validation strategy that we use to assess different hyperparameters seems convinced that the zero-trajectory regime is optimal. Does your final trajectory activity plot look like this example? The point I’m trying to draw attention to is the fact that the best (lowest) CV score appears to be at ~zero trajectory activity.
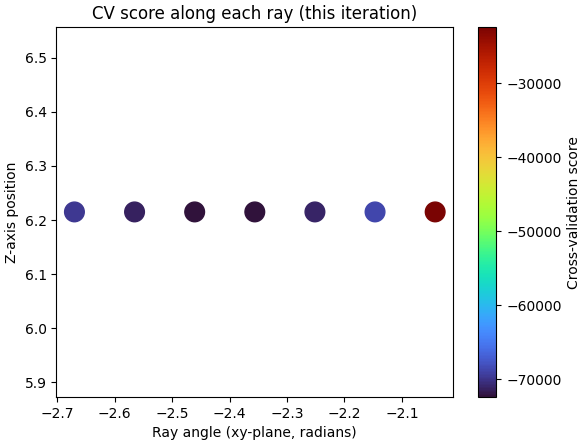
In this situation, I’d recommend manually putting in override hyperparameters. You can figure out what parameters to use as follows. Walk backwards through the hyperparameter optimization iterations and try to find the iteration where the best non-zero trajectory point occurs (using the trajectory activity vs CV score plot again). Then use the “CV score along each ray” plot to identify the best hyperparameters to use. Pick the darkest/bluest dot and match up the z and theta values to the table that is printed at the start of the iteration (example below)… on the left side of the table, there’s the r/theta/z parameters and on the right side you can read off the corresponding hyperparameter values
Thanks for the info. Using the former (and not the latter) suggestion I was able to get tiny motions (trying a few values from the plots/tables give similar result). I will follow through and see if they yield reasonable reconstructions.
Below are PatchMotion (live) and RBMC for the same micrograph.
Hi @CryoEM2. Yes it’s possible that the zero trajectories could cause early convergence. If that happens, there will be a message in the stream log saying so. But in this case I think those trajectories are still over-regularized. Perhaps consider walking back even a little bit further.