Hello discussion board,
I am working with an ectodomain construct of a receptor that is approximately (82 kDa) with an IgG bound to it. I would love a fab but IgG is what we have available to use. Data is collected on a glacios with a k3 and to get this far, I have had to combine datasets (which is furthest Ive got with this particle). What I have encountered thus far is that due to the shape of the receptor and (what I am able to see), the protein is elongated and thus would have relatively poor signal to noise ratio. 2D classification, was only really successful at removing clear junk (see round 1 of 2D below, clear junk to me, is the classes that are likely ice and weak spherical averages). I am struggling to discern top/down views of the complex as the IgG is somehow not present in the averages. Therefore I turned to particle sorting in 3D using multi-class ab initio and heterogenous refinements.
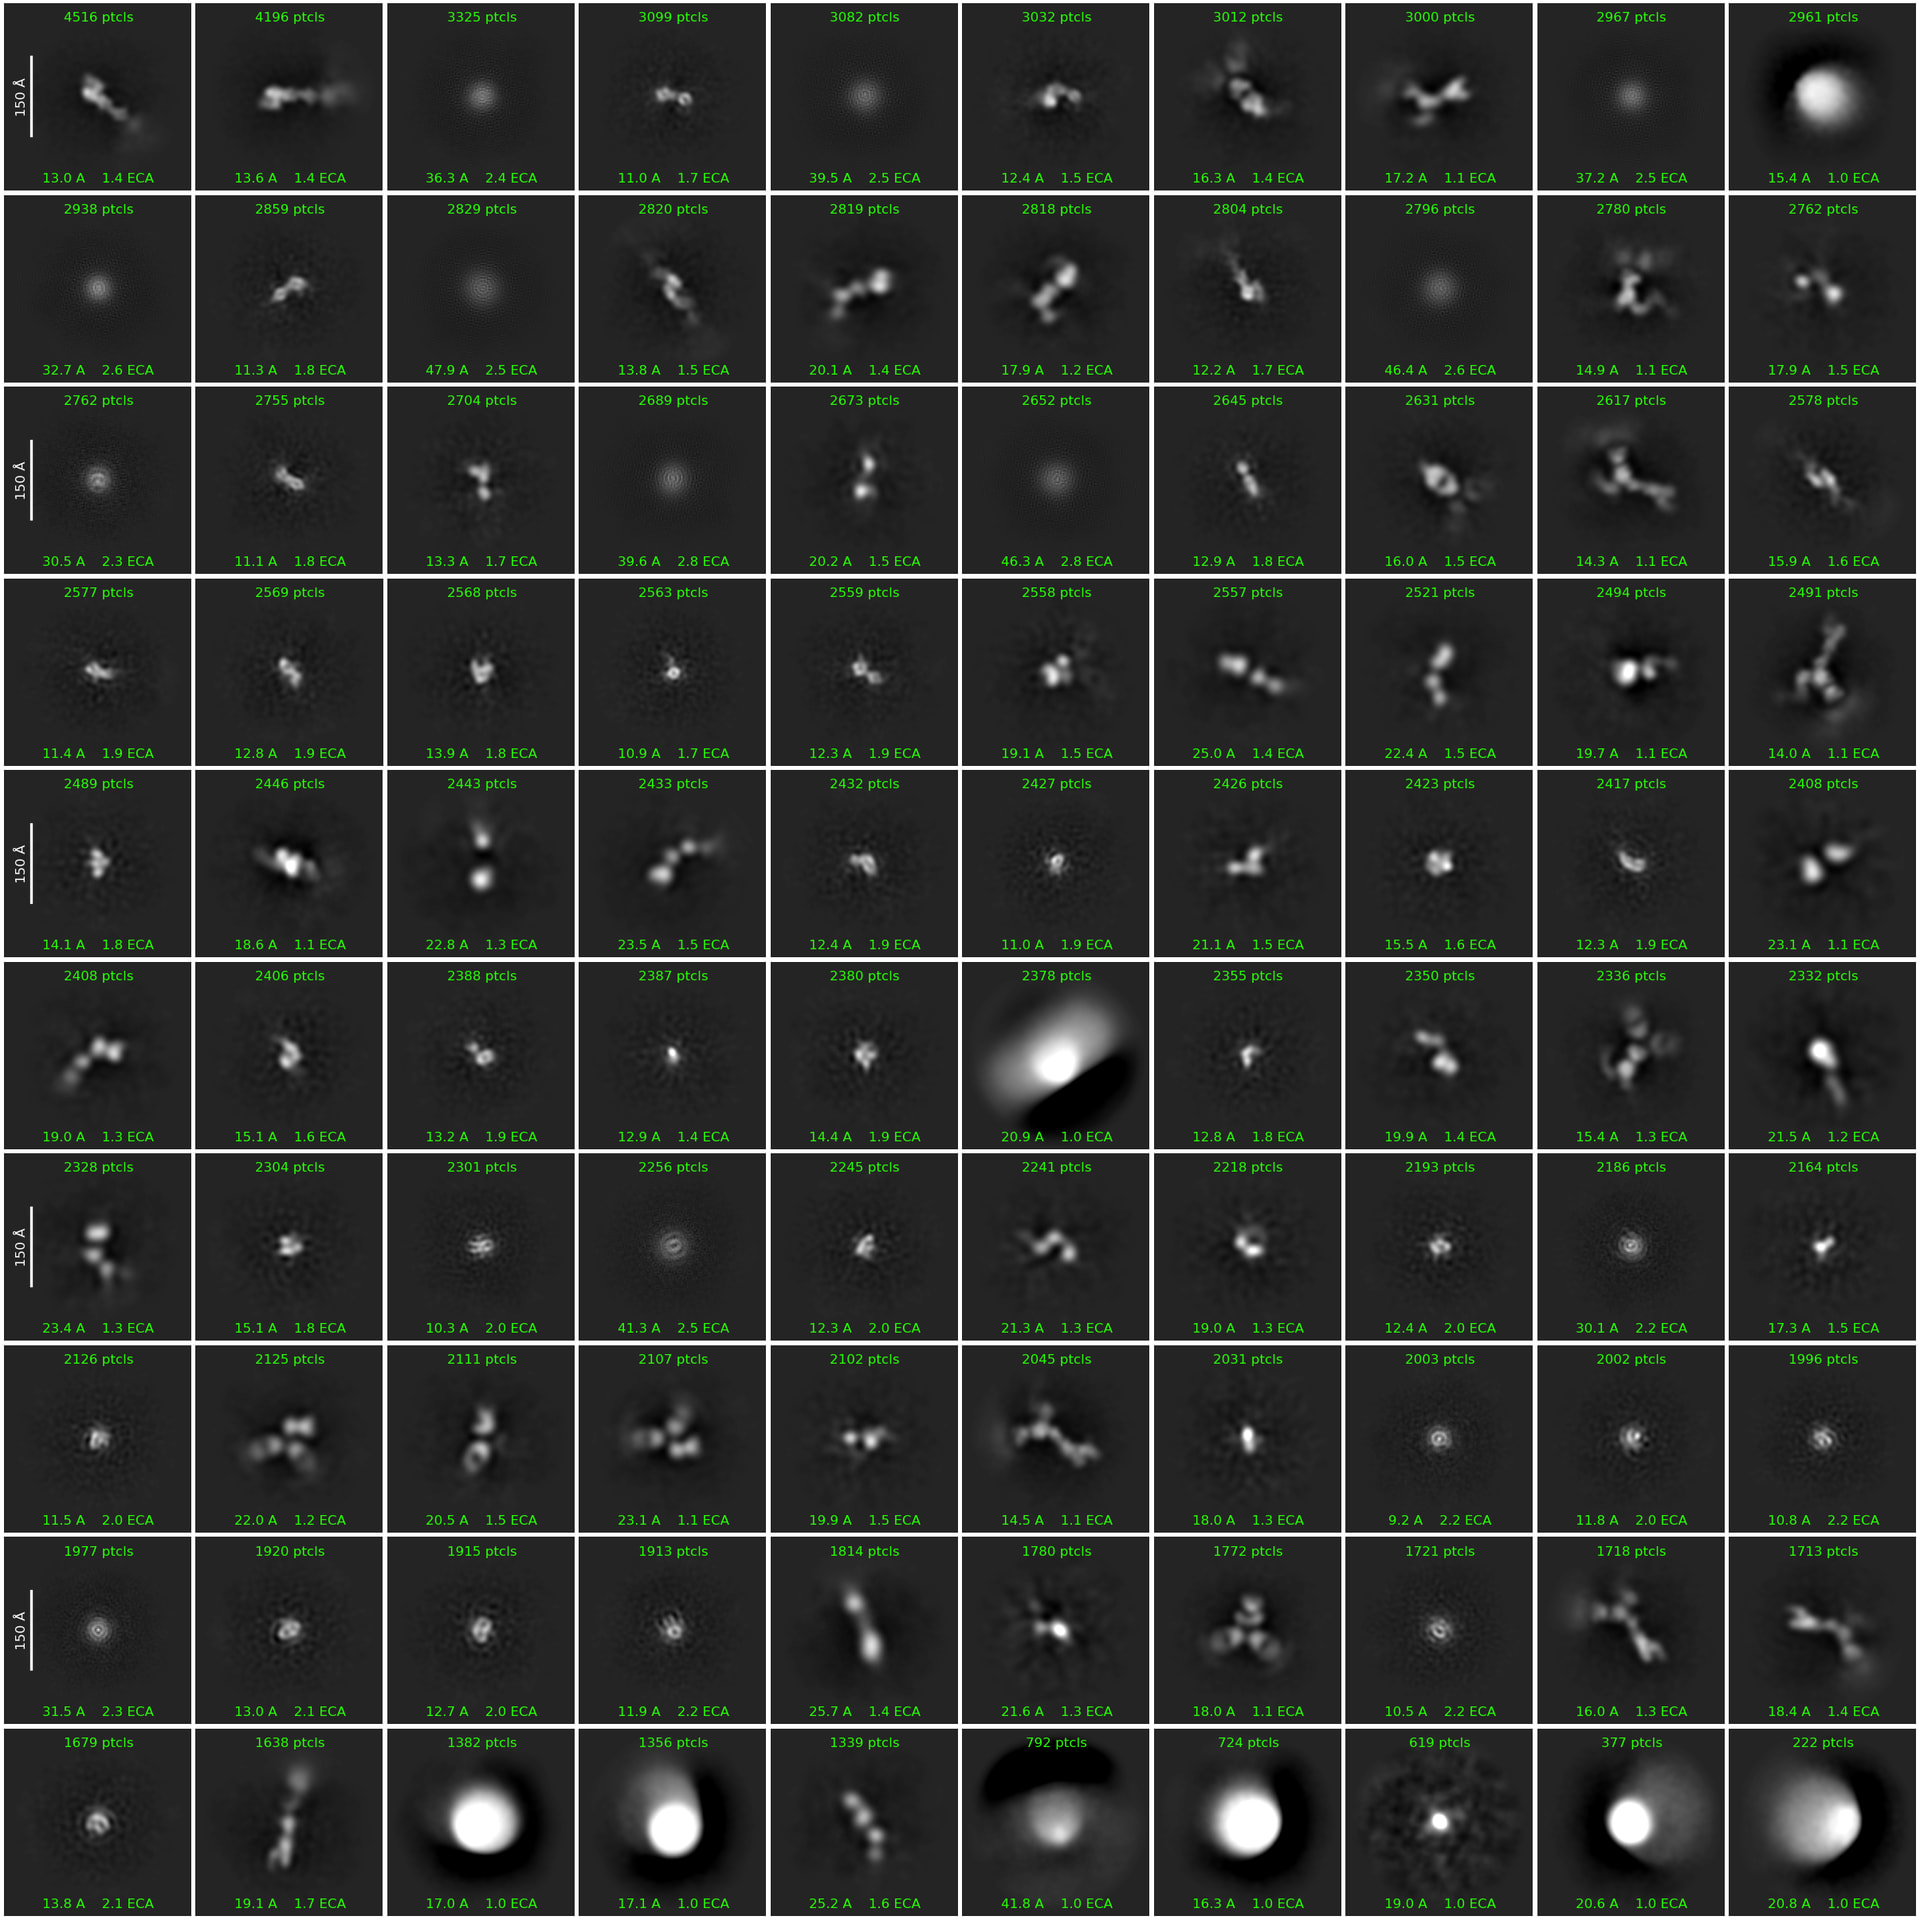
Figure, round 1 of 2D classification with binned particles (320px → 160).
I won’t go into details of the weeds of ab initio and heterogenous refinement (unless you have questions, which I can). Overall, I found that for this particle, changing the Fourier radius step on ab initio to smaller (ie 0.02). it took longer but doing NU refinement afterwards yielded a better map. Through cleaning up in 3D, I re-extracted particles without binning. Then doing another NU refinement and local refinement.
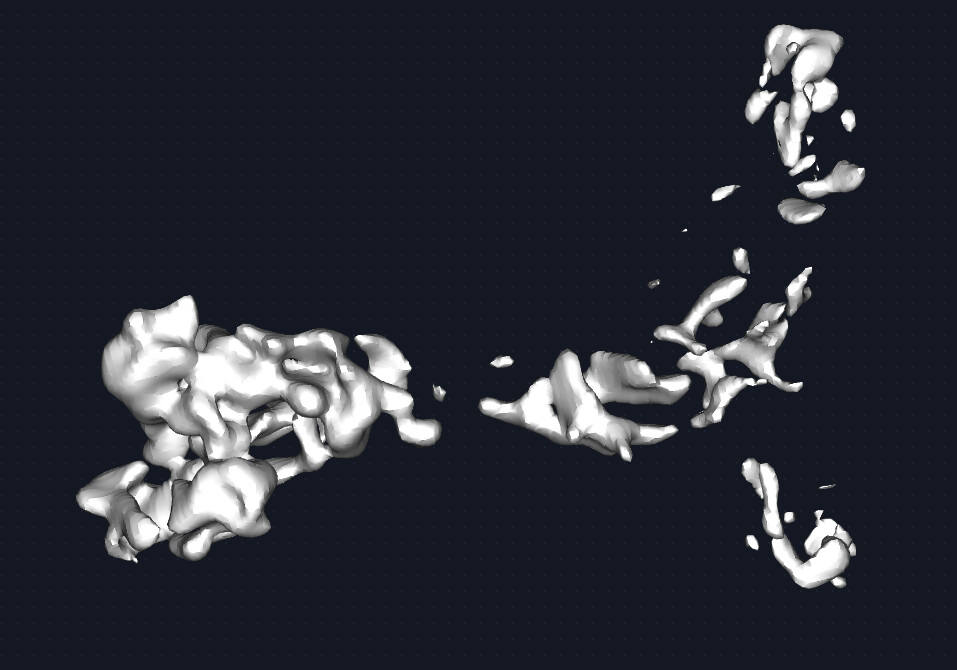
The map could be better. Given the quality of the density, I would estimate this to be medium ish resolution (despite what CS estimates). say 6-8A. this receptor is beta sheet heavy and with unstructured loops connecting the domains together. Therefore, it was difficult to discern the correct handness for a while but that is figured out now. Shown is the map at 0.2 and 0.6 threshold respectively. I see the beginning of some grooves and features but nothing more. The fab portion of the IgG is present and has helped with particle picking.
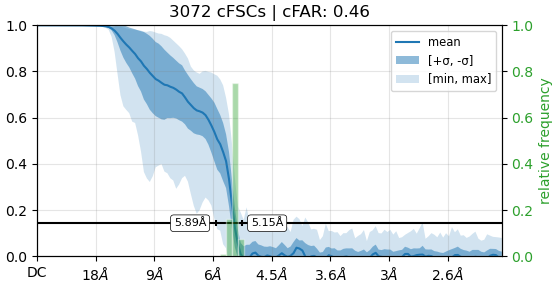
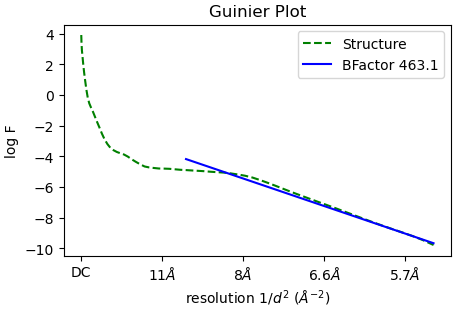
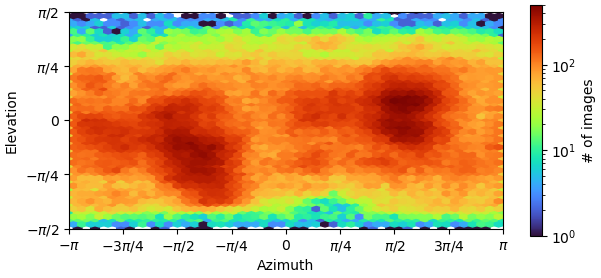
The B factor is quite high(?) for this reconstruction, I have 290k particles. The angular distribution is suggesting of preferred orientation with the two bright spots. I am sampling the other views but lacking the pi/2 views. The cFAR score is better during the combined datasets here vs the independent datasets.
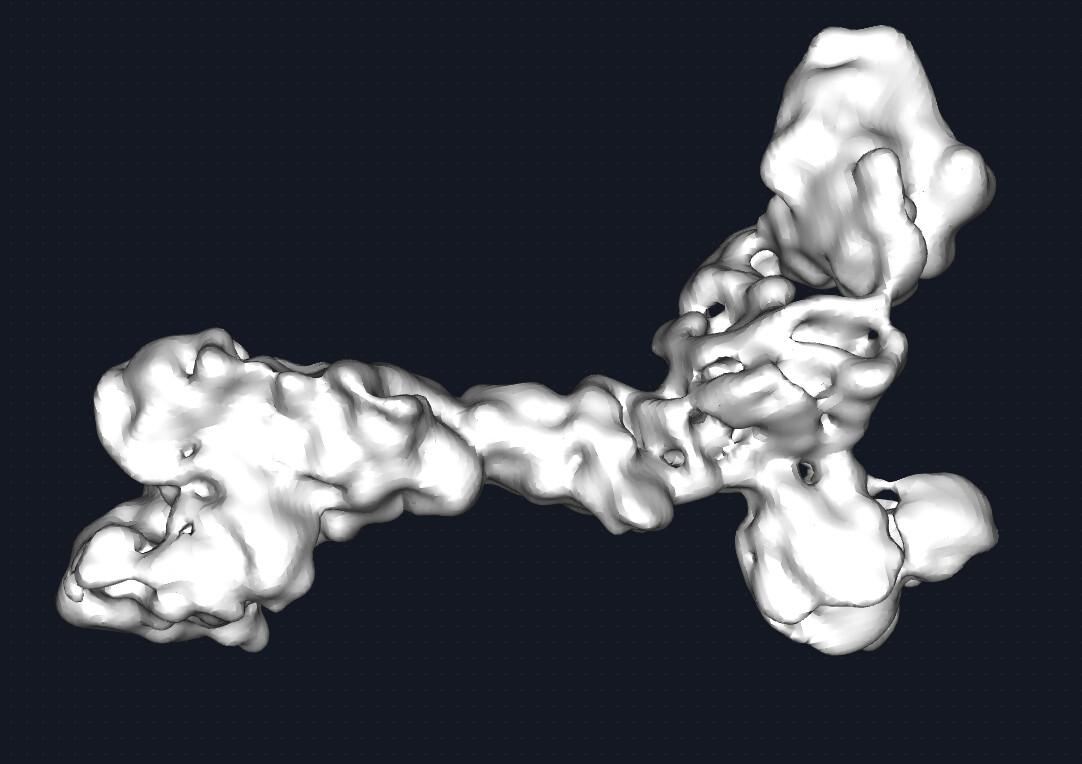
I moved to local refinement in hopes of masking will provide better alignments of particles. I made a mask around the protein and only the variable regions of the fab. Shown is the local refinement map at 0.4 threshold, followed by the sharpened map at 0.4 and 0.6 threshold respectively.
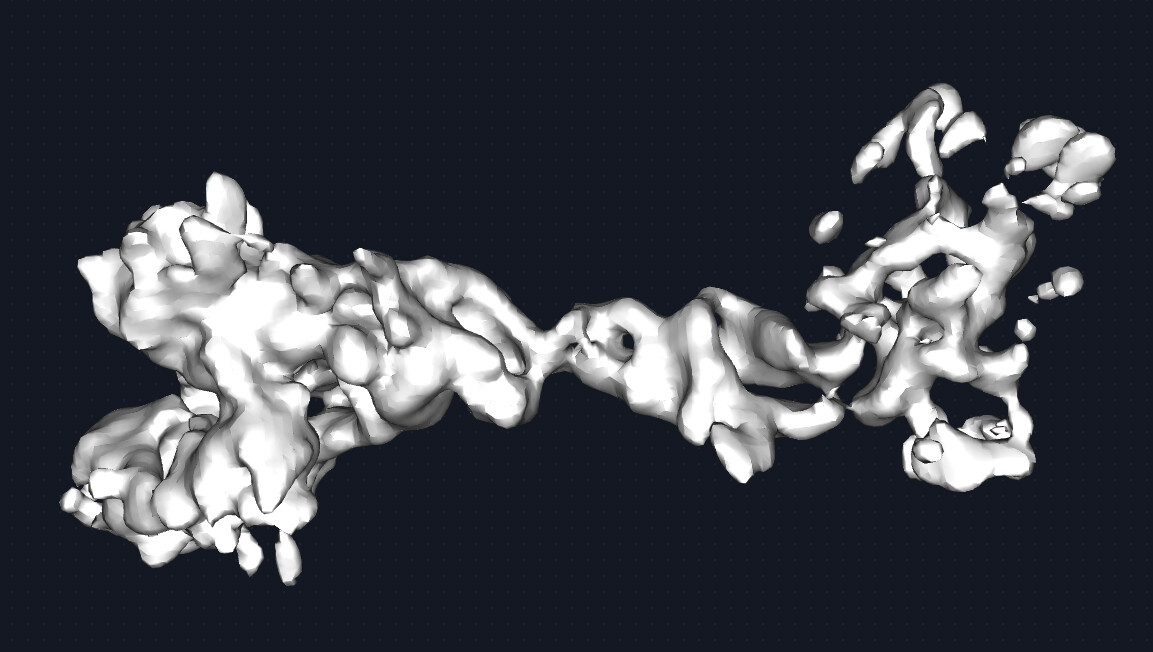
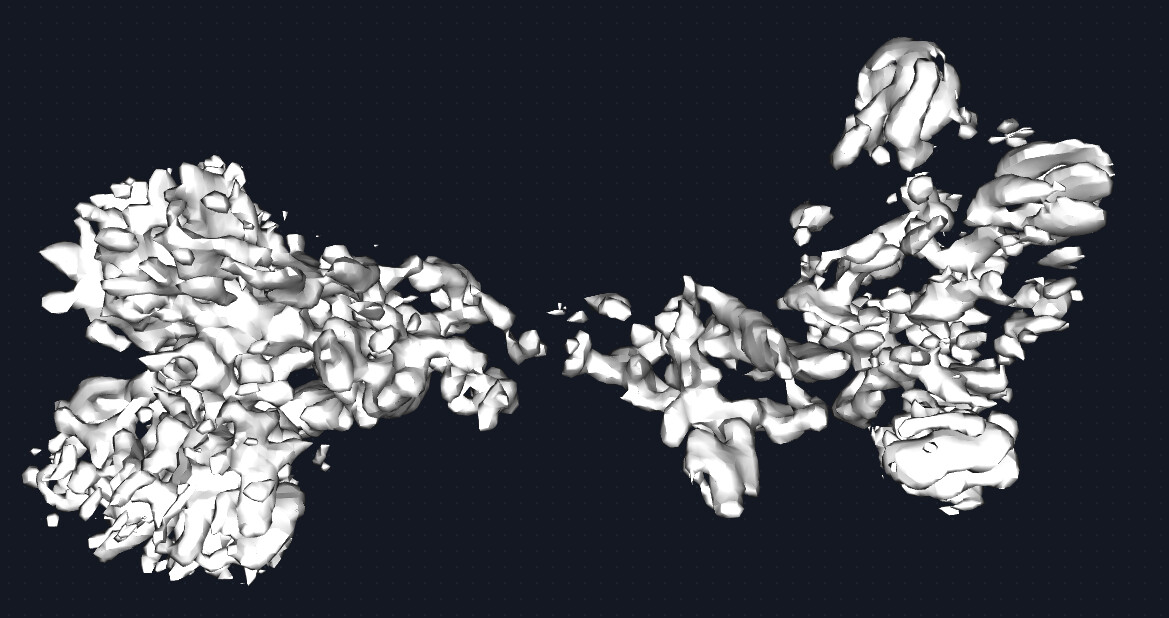
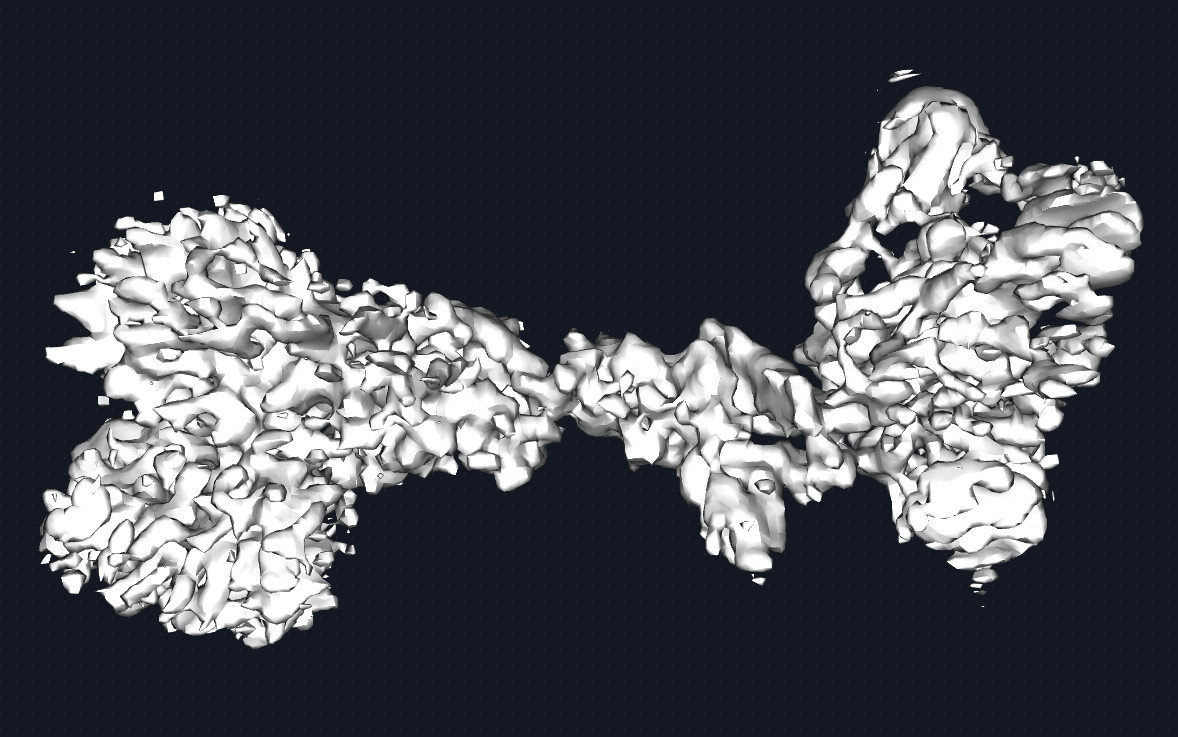
What I am happy about is that is that the PDB crystal structure does fit well overall. which is a confidence boost. however, the density of what would be the backbone is quite disconnected within the sharpened map and it not visible at all in the unsharpened. I presume that the sharpened likely is also sharpening potential noise? Although the preferredness is definitely showing at the exteriors of the map from the stretchiness.
- One of my questions here is that the density seems to be falling away from the center instead of the sides. I do think that given my 2D, the center of the particle is that middle domain that is between the head group (left) and where the IgG binds. I do not think this is normal? At least for my other projects, I do not see that.
-
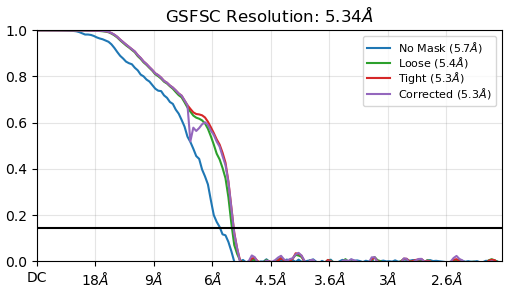
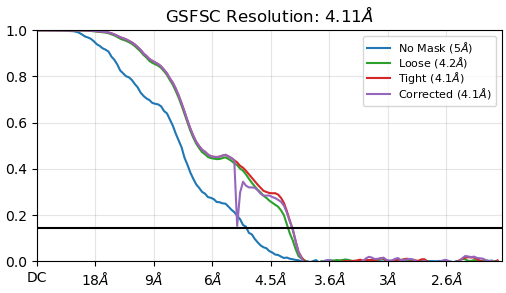
My FSC of the local refinement is not a totally smooth curve down towards zero. It doesn’t rise as I remember in a few other posts here but I think it is a similar issue. this is not a full-length construct and no membrane, so I am not expecting a bump at 5A ish. This was a flag to me. Am I right to think so?
-
Generally, is sharpening map from the any refinement job different compared to the sharpening tools job itself? Should I be trying to sharpen at various B factors?
3.1) For the case here, how could I reason that the “features” that I am seeing in the sharpened map from local refinement is noise?
- Reslog analysis suggest that going from 10^4 to 10^5 particles yields an 1.3 A increase in resolution. the trend isn’t flat-lining but for 10x the particles for 1.3 increase is quite low?
I am not sure if this is a data processing issue with the map qualities and features. or is this simply just more particles.
Thank you. Happy to provide additional details.