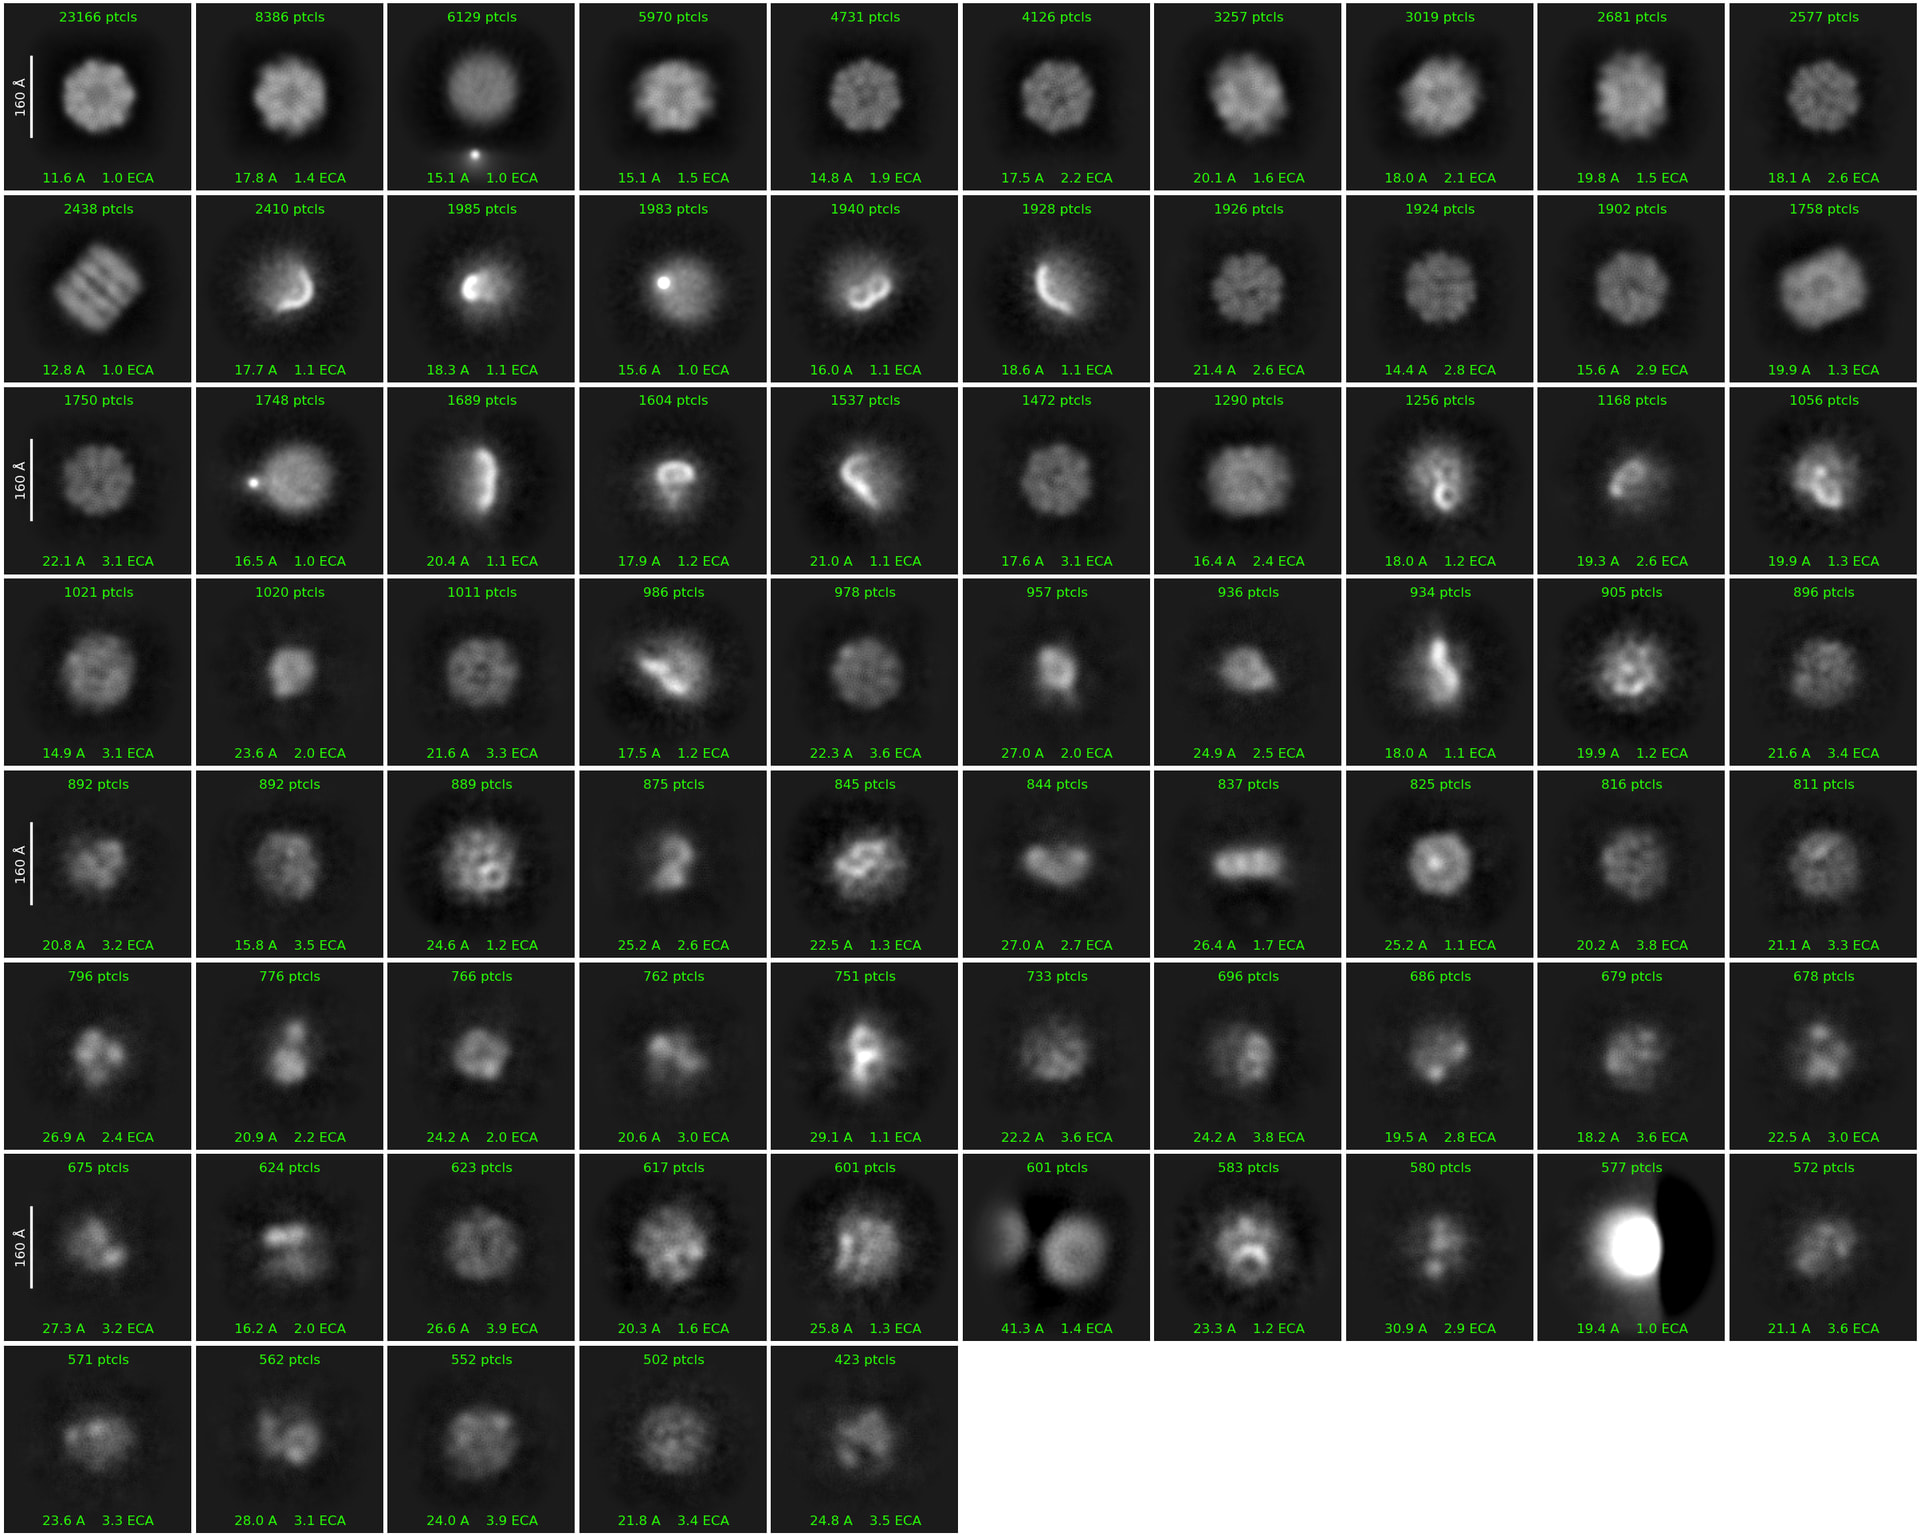
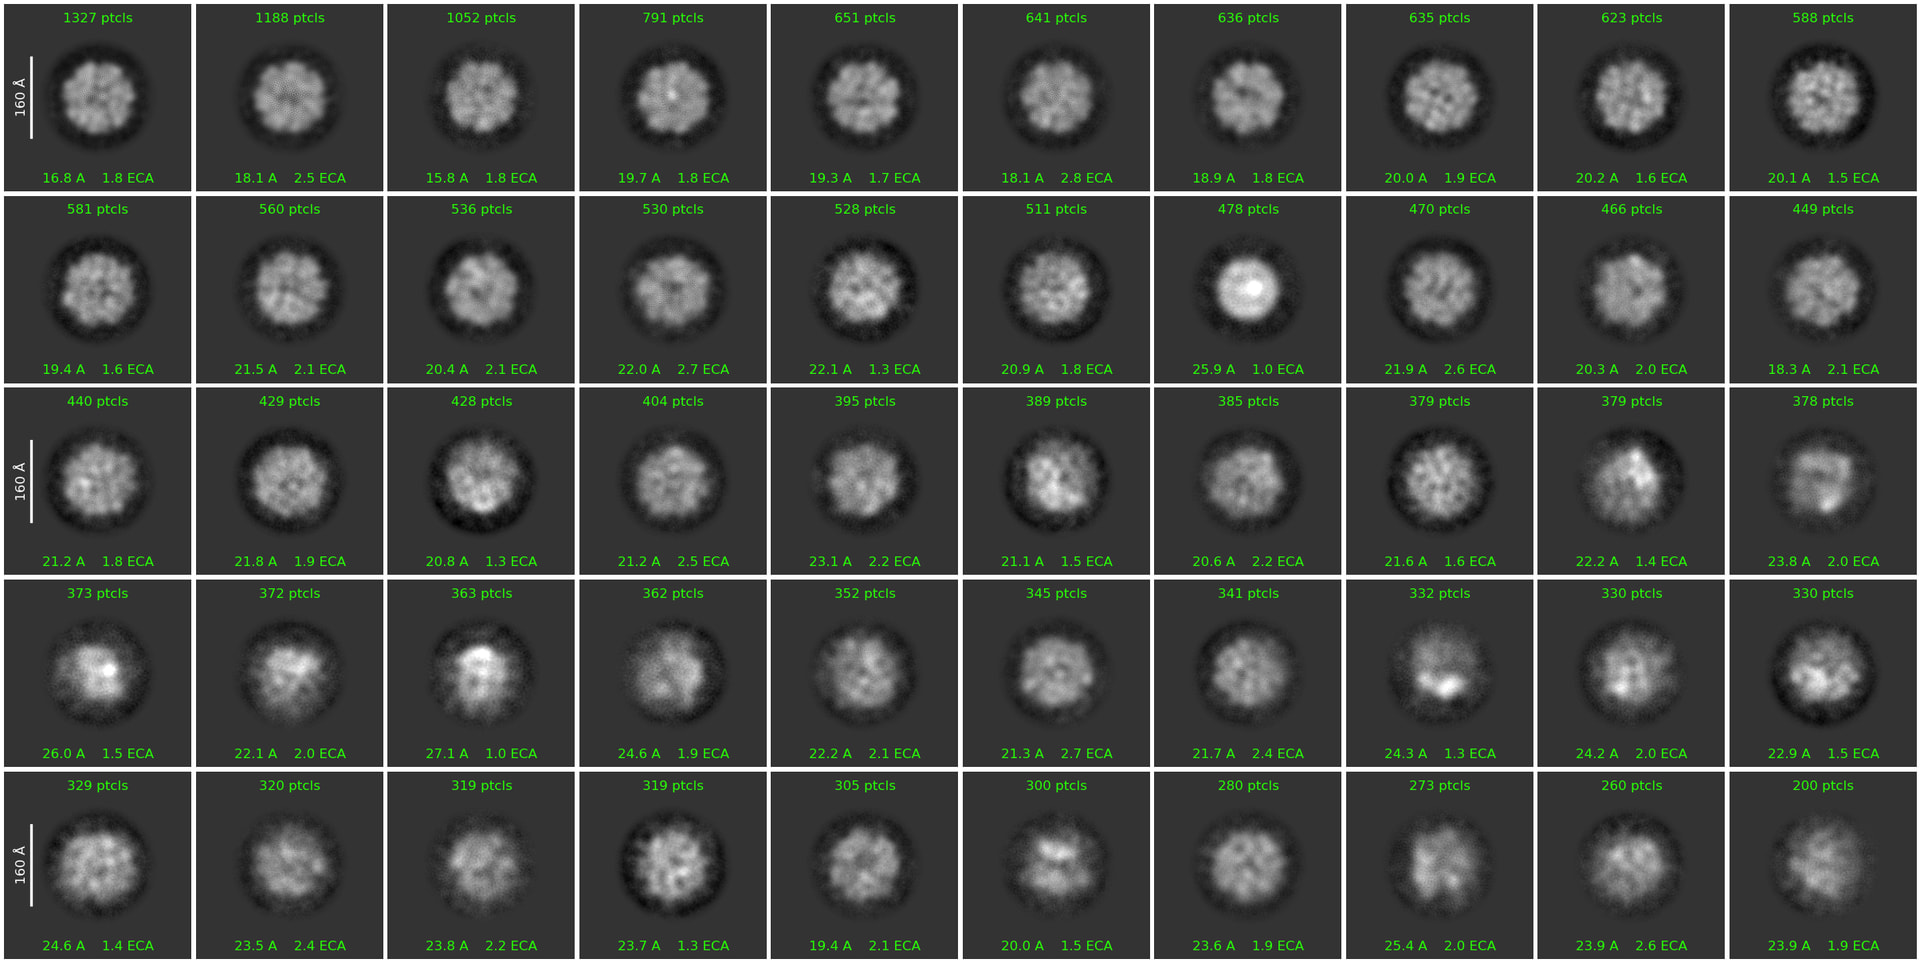
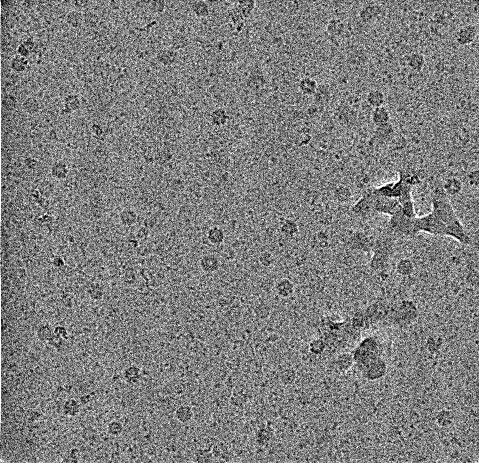
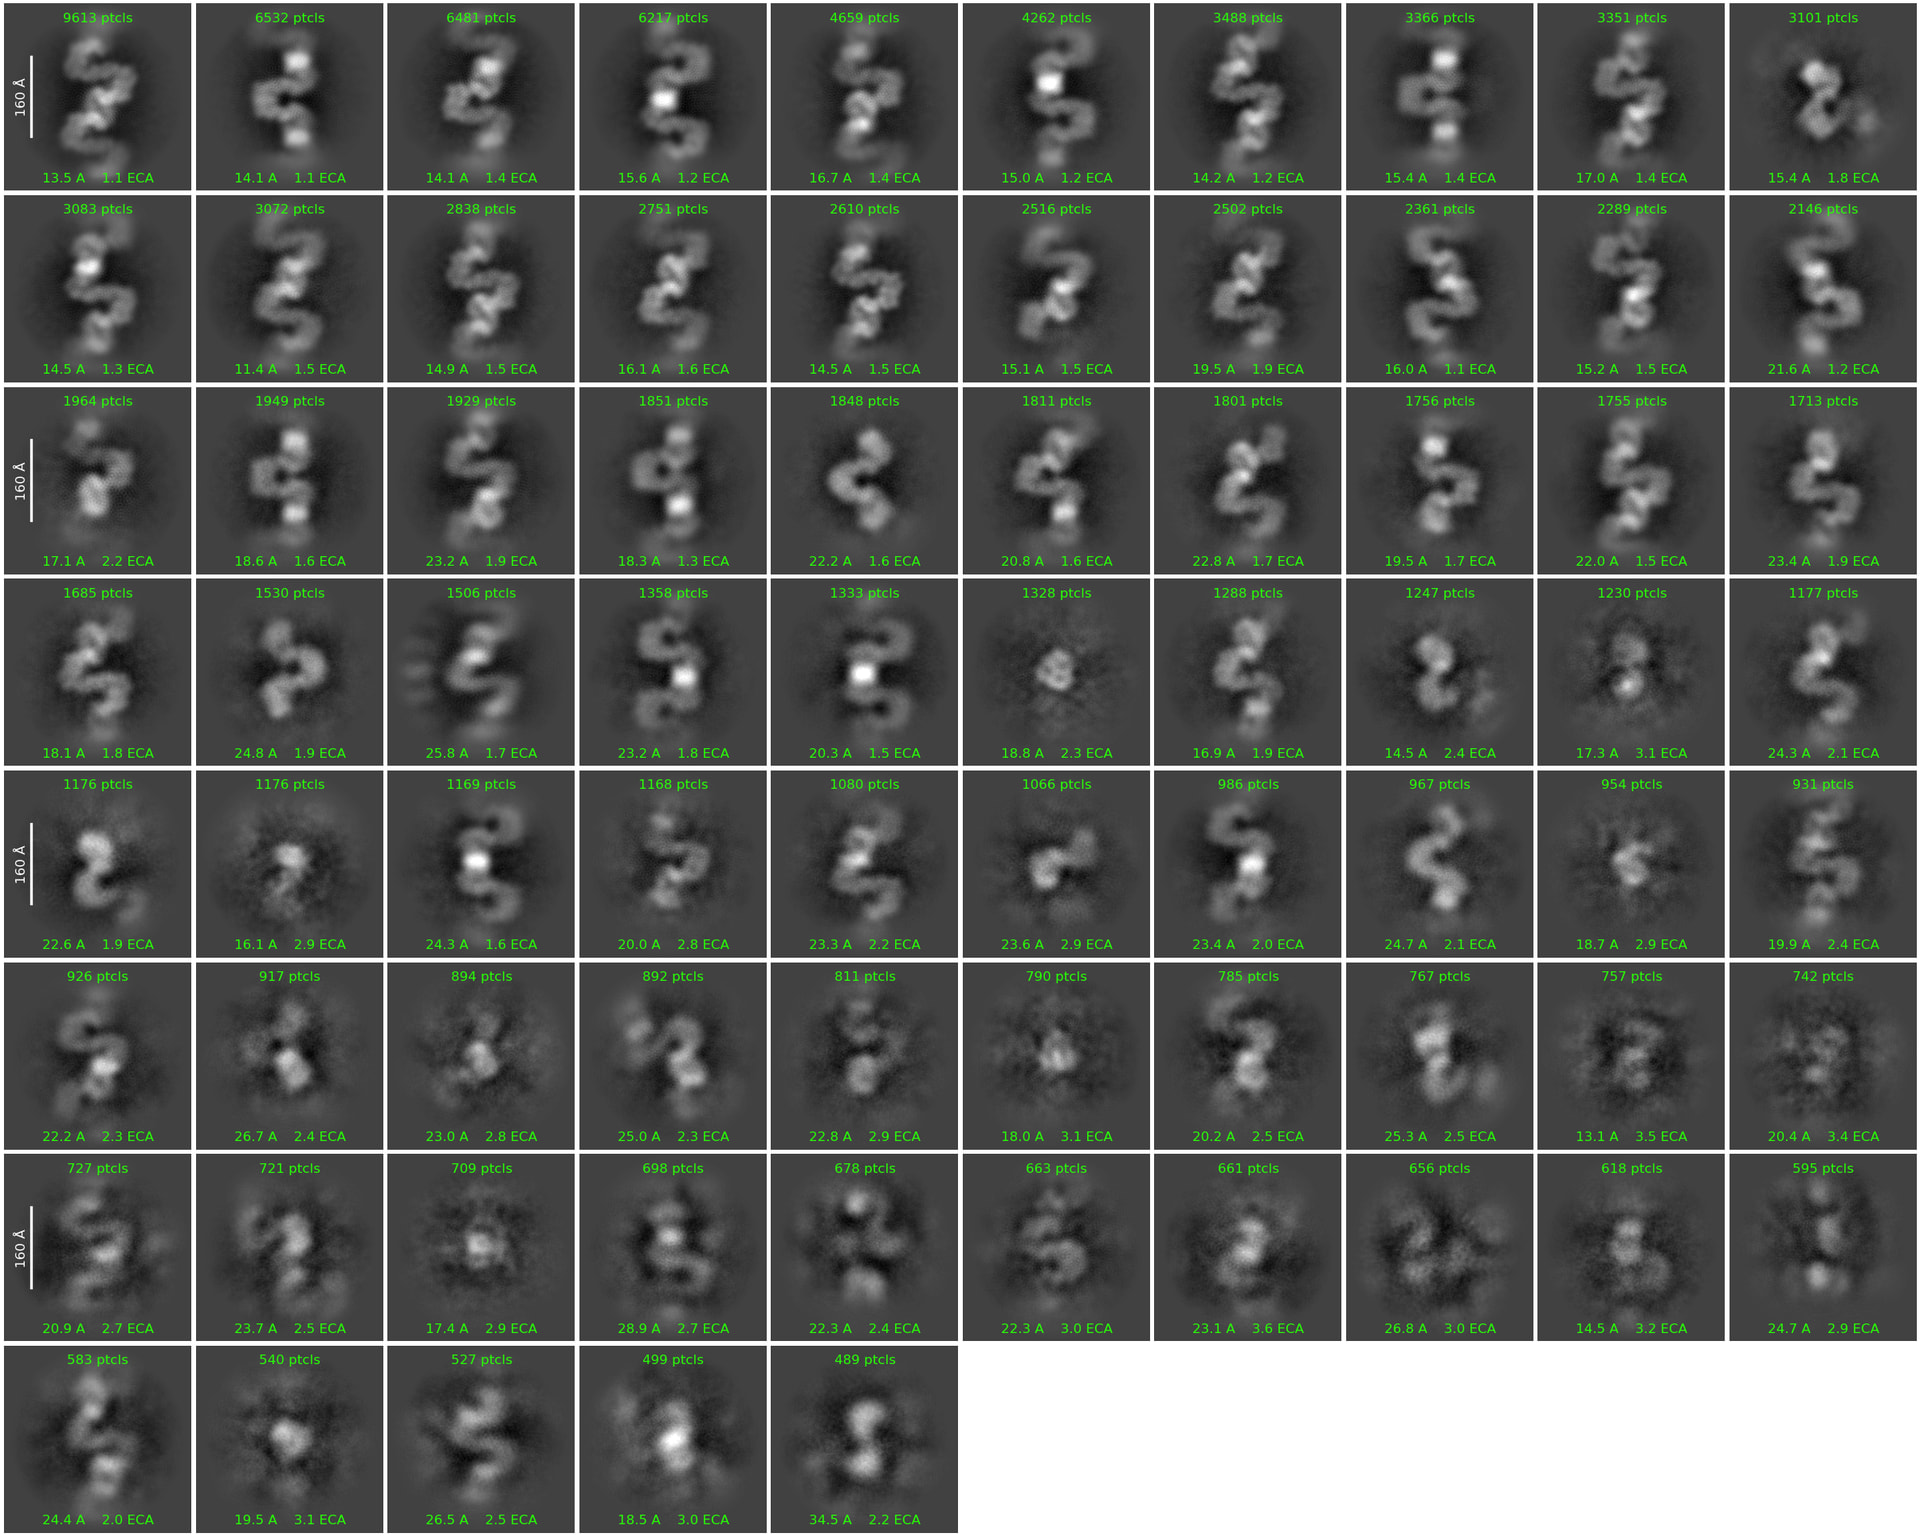
Hi, I am trying to solve a heptameric oligomer of ~350 kDa; however, despite the CTF fit resolutions being well within 7 Å. The 2D class averages look very blurry (with fewer features visible) and range from 15 to 25 Å. I have a mixture of GroEL contaminations with my protein of interest; however, both proteins are stuck in that low-resolution range. Here I am attaching the reference micrograph and 2D class averages. pixel size is 1.17Å, 20 frames,320pixel box size.
I did not see any burning in the images either. The defocus range is also well within the range of -1.25 to -2.75. I have tried 40-frame data collection, with gain preprocessed and unprocessed. The thon rings were excellent for both samples. Any suggestions appreciated!
I’d be a little worried if your CTF fits are around 7 A – do you mean that they are all below 7A fit for the samples? Even on our Tundra, most CTF fits are around 4-6A, and folks for Krios data sets often only take data that were fit to below 4 or 5A.
Also, defocus sounds like it’s a little high. You lose higher-resolution information the higher your defocus is; we usually collect at -0.5 to -2 or so on our Tundra and smaller on the Krios. We only use around -3 for screening. However I wouldn’t think that this alone would cause you to have issues at the 2D stage.
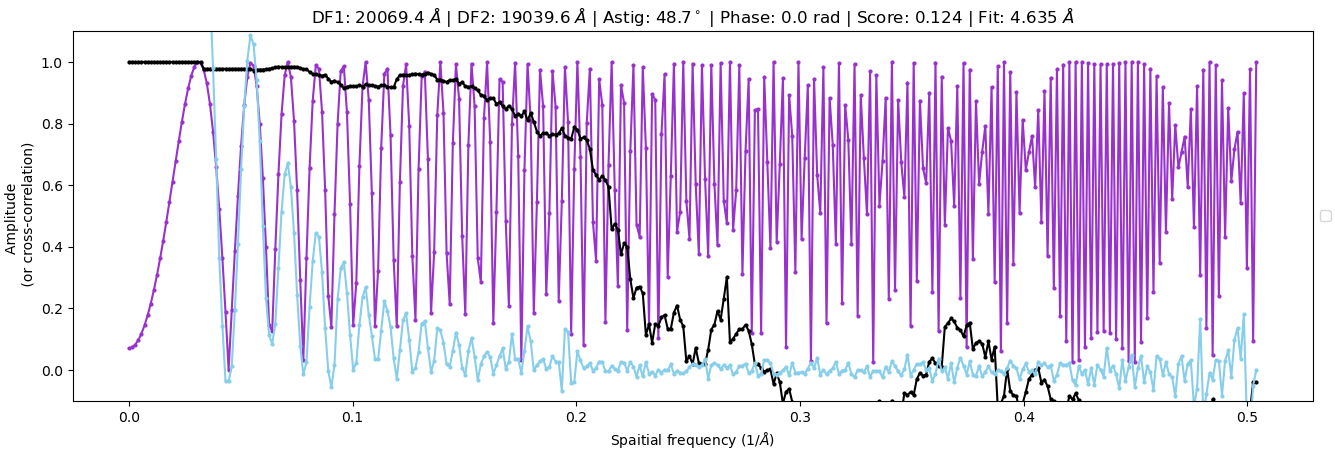
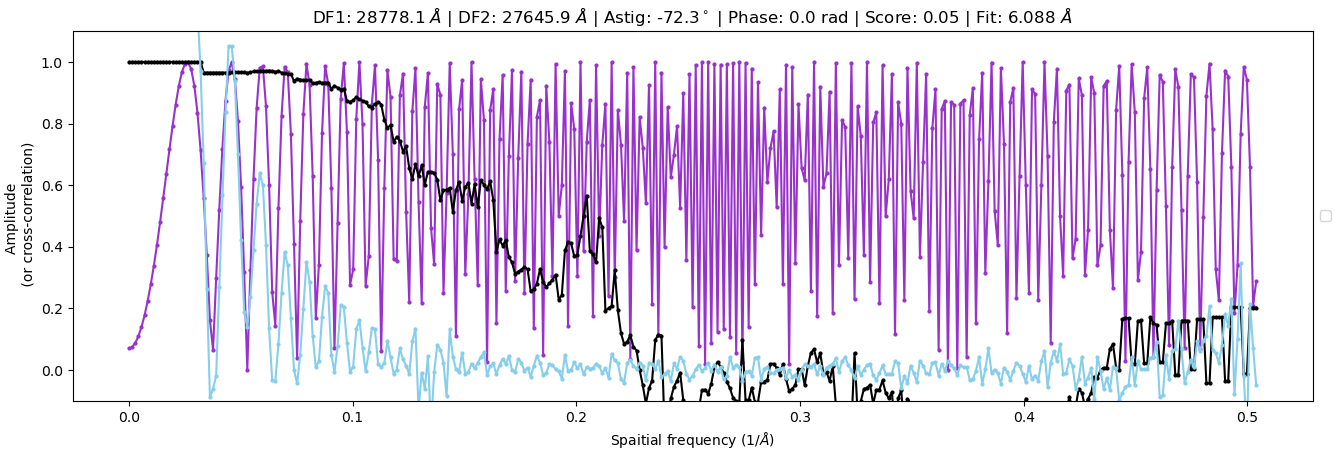
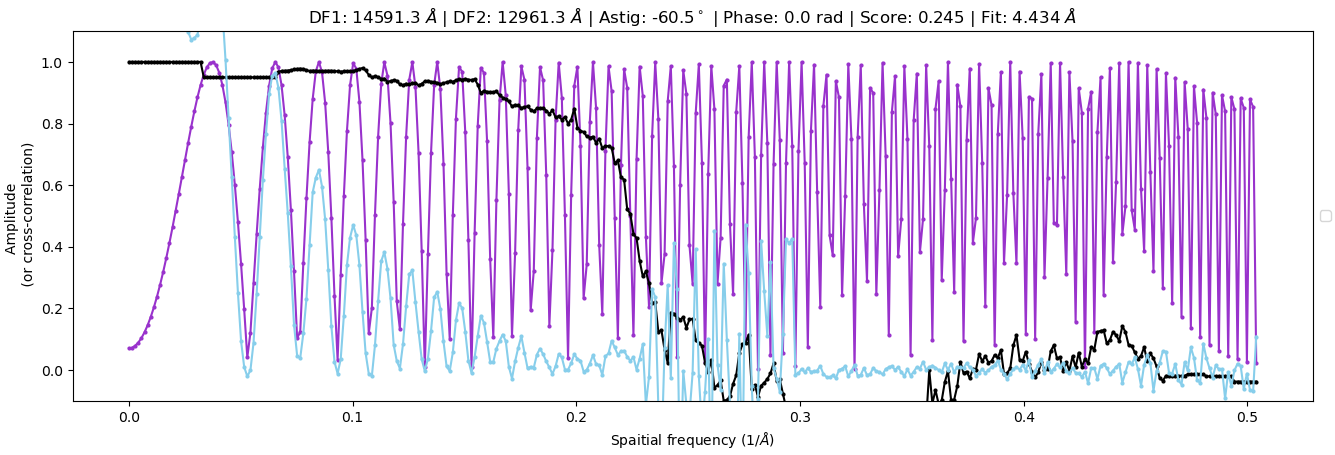
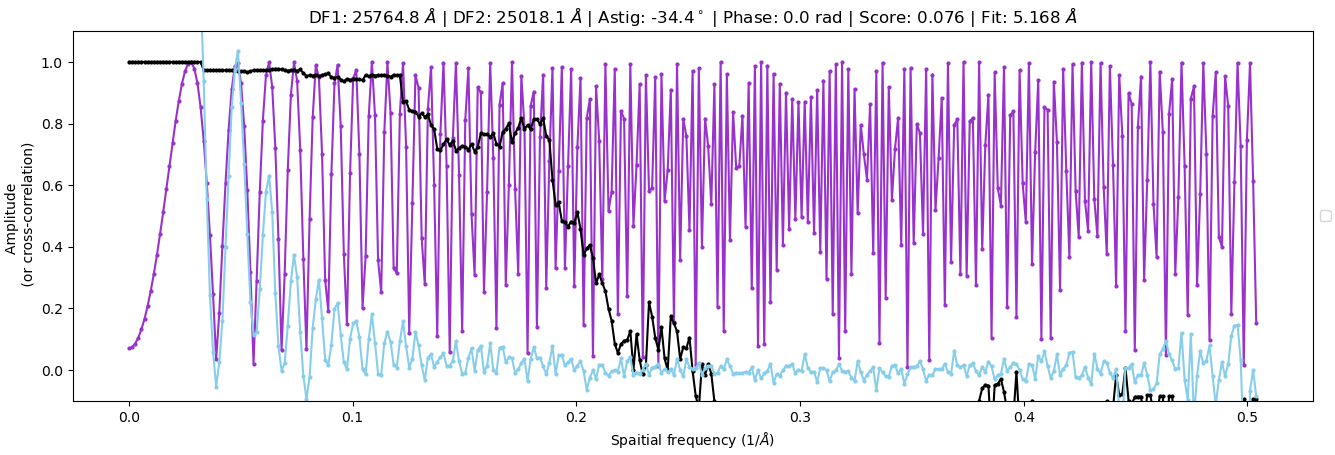
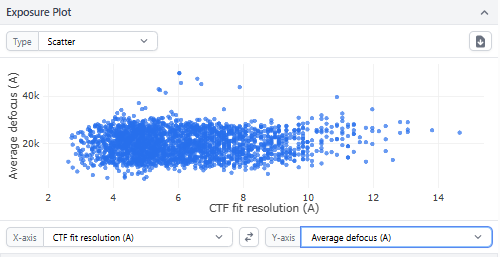
What dose are you using to collect your data? Can you show some of the CTF fit graphs and the overview graphs of CTF scatterplot?
Are you downsampling your boxes at all? That can influence things as well.
In manual curated exposure (3,5 CTF fit resolution), 33% micrographs fall in that range. I understand it is relatively lower resolution compared to other Krios. I agree defocus range is on the higher side. But as you also pointed out, this should not cause the disastrous 2D quality.
The dose is 40e/A2. I am running 2D without any downsampling
2D classes look like the ice is very thick… is the 200KV and Krios data taken from the same grid? Background is also extremely “high” on the example micrograph, which also happens with thick ice. Did you use EPU for acquisition? If so, do you remember what it reported as dose-on-sensor through the sample? If loss is >25%, you’re probably going to struggle.
Yes, it is from the same grid, and ice was medium (if I remember correctly). We used latitude S. I saw it varying from 35 to 42 e/A2 (range). Indeed, I am struggling. I checked with other people who collected data in a similar window, and it seems they are also getting stuck at a similar low resolution. Any idea, what could be the cause?
If you measured the dose-on-sensor in vacuo to be 40 e-/Å^2, having >40 e-/Å^2 through a sample would break the laws of physics…
Check the microscope alignment, if similar issues are encountered across a range of samples and grids (prepared by different people) it’s less likely that it’s the sample.
Agreed with all of @rbs_sci ‘s good points. A few additional thoughts:
What is your sample buffer? Glycerol at any concentration or some other additives can cause issues of poor contrast.
Have you visually inspected micrographs in each of the CTF categories? I suspect that most are around 5A because of the thick ice issue (if you can provide an atlas and grid square picture, that might help, but agreed best is dose on empty area vs dose on camera for micrographs). Occasionally all the best micrographs are just because there is carbon foil in the image.
This is more out of curiosity, but where did your purple 1D CTF plots come from? The reason I ask is because they aren’t envelope-corrected, which I haven’t seen in CS in live, patch CTF, or curate micrographs. Were you using CTFFIND as opposed to patch CTF? I just tried to check as I haven’t used it in a while, but ours seems to be malfunctioning, so it’ll be a minute
Edit: I remembered that CTFFIND doesn’t support 16-bit floating point. Is there a reason you prefer CTFFIND over patch CTF?
@rbs_sci Alignment seems to be fine as far as I know. Let me check with the manager about the dose on the sensor in the vacuum! @tlevitz 1. Sample buffer is 25 mM sodium acetate, 150 mM NaCl (pH 5.2). 2. I did see some micrographs have a carbon area coming in, but not the majority. 3. Not much of a reason, I use patch CTF generally, but for quick analysis and CPU-based processing. I used CTFFIND.