Hi,
I would like to plot for each iteration the FSC curve. I know how to download the data for the last iteration but how can I get that information from previous iterations?
Thanks
Roberto
Hi,
I would like to plot for each iteration the FSC curve. I know how to download the data for the last iteration but how can I get that information from previous iterations?
Thanks
Roberto
Hi @rmarabini ,
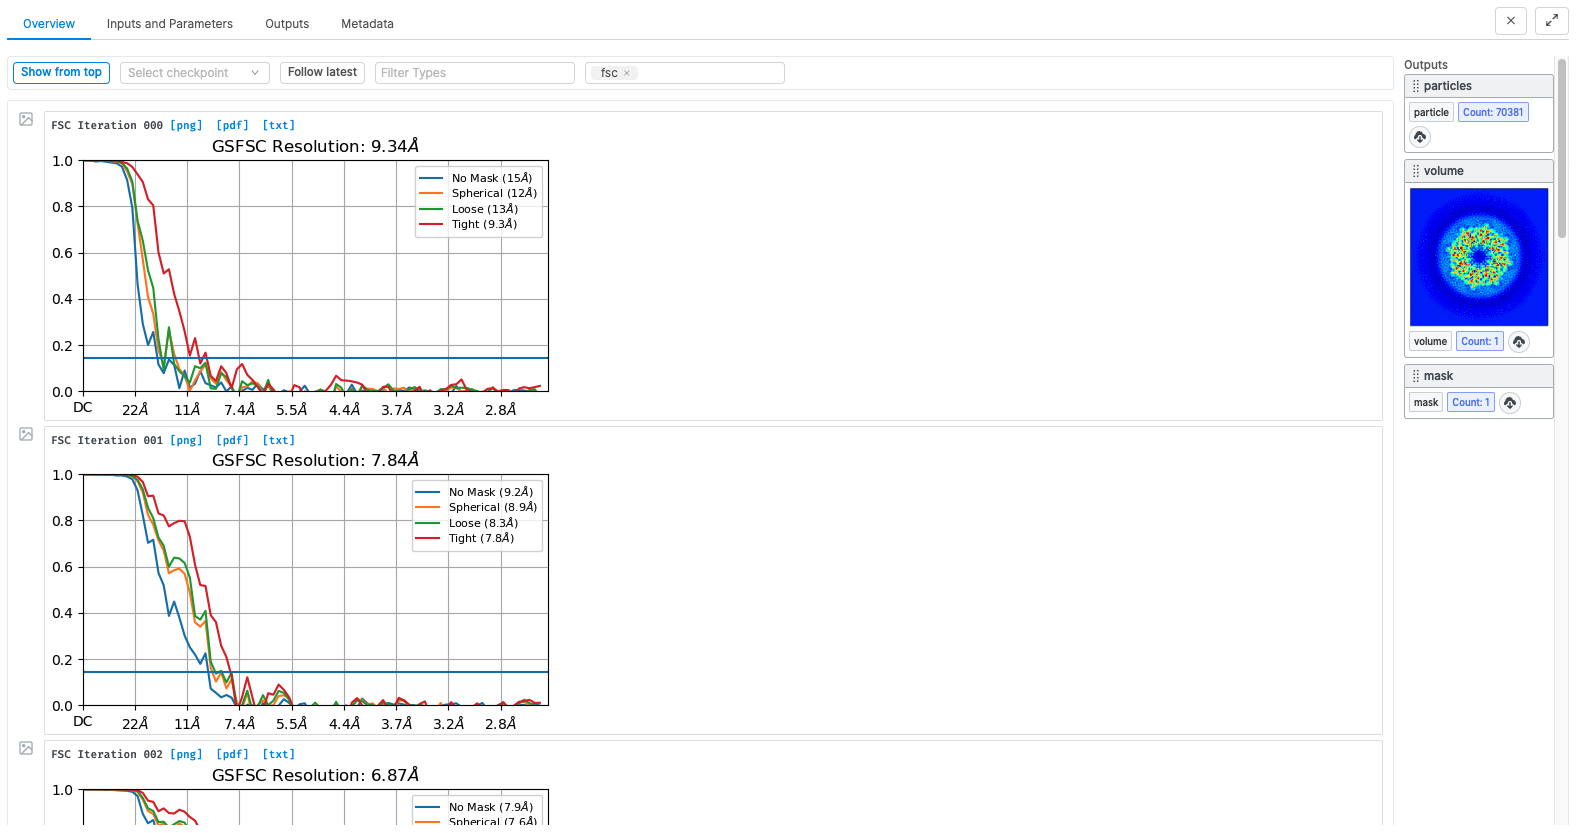
When you preview a job, the event log contains a full history of iterations with images and raw data available for download (the blue links above each image). To see all of them at once, click ‘Show from Top’ and add ‘fsc’ to the flags filter:
More information with regards to interpreting the raw data (txt) is available on this previous topic: Export FSC data for plot
- Suhail
Thanks for the answer. It has been very useful