Hi,
I am trying to troubleshoot performance issues on my GPU, and figure out whether they are hardware or software related.
Does anyone (@stephan?) have completion times for the benchmark workflow (https://cryosparc.com/docs/tutorials/extensive-workflow) with or without the “all job types” option?
Cheers
Oli
1 Like
March 2021 Edit: Updated benchmarks for cryoSPARC 3.1
Hi @olibclarke, here are the results from our tests with cryoSPARC v3.1 on a 4GPU machine with the T20S subset:
The Extensive Workflow takes ~1 hour with the default settings and ~1 hour 30 minutes with all job types enabled (note that some jobs run in parallel when enough GPUs are available).
Here are some rough average completion times for each job type:
| Job Type |
Approximate Run Time (seconds) |
| Import Movies |
92 |
| Patch Motion Correction (Multi) |
220 |
| Full Frame Motion Correction (Multi) |
75 |
| Patch CTF Estimation (Multi) |
66 |
| Curate Exposures |
1.1 |
| Blob Picker |
12 |
| Template Picker |
13 |
| Inspect Picks |
12 |
| Extract from Micrographs (CPU) |
39 |
| Extract from Micrographs (GPU) |
43 |
| Local Motion Correction |
180 |
| Select 2D Classes |
7.5 |
| Ab-Initio Reconstruction (1 class) |
450 |
| Ab-Initio Reconstruction (3 class) |
800 |
| Homogenous Refinement |
1940 |
| Heterogeneous Refinement (3 class) |
3000 |
| Non-Uniform Refinement |
4300 |
| Sharpen |
32 |
| Validation |
94 |
| Global CTF Refinement |
41 |
| Local CTF Refinement |
46 |
| 3D Variability |
560 |
| 3D Variability Display |
140 |
3 Likes
That is exceedingly helpful, thank you @nfrasser!!
It seems like my root dir is very small (18G) and cryosparc was filling up /tmp/. somehow that was causing a slowdown I think, because when I move /tmp/ and symlink it back to root, I get results comparable to what @nfrasser posted, whereas previously it completely stalled overnight. Don’t know if that makes any sense but fingers crossed I think the issue is fixed, regardless!
2 Likes
I am still having issues with this same GPU… the performance benchmarks look fine, but when I run a bunch of jobs sequentially with large particles (512 box size) they get progressively slower. Particularly noticeable with local decomposition and FSC calculation steps which become extremely slow (many hours). The GPUs look fine in terms of temperature and usage, so I’m not sure what the issue could be - could it be the SSD? One NU-refine job only completed the first iteration (8000 particles) overnight…
Hi @olibclarke,
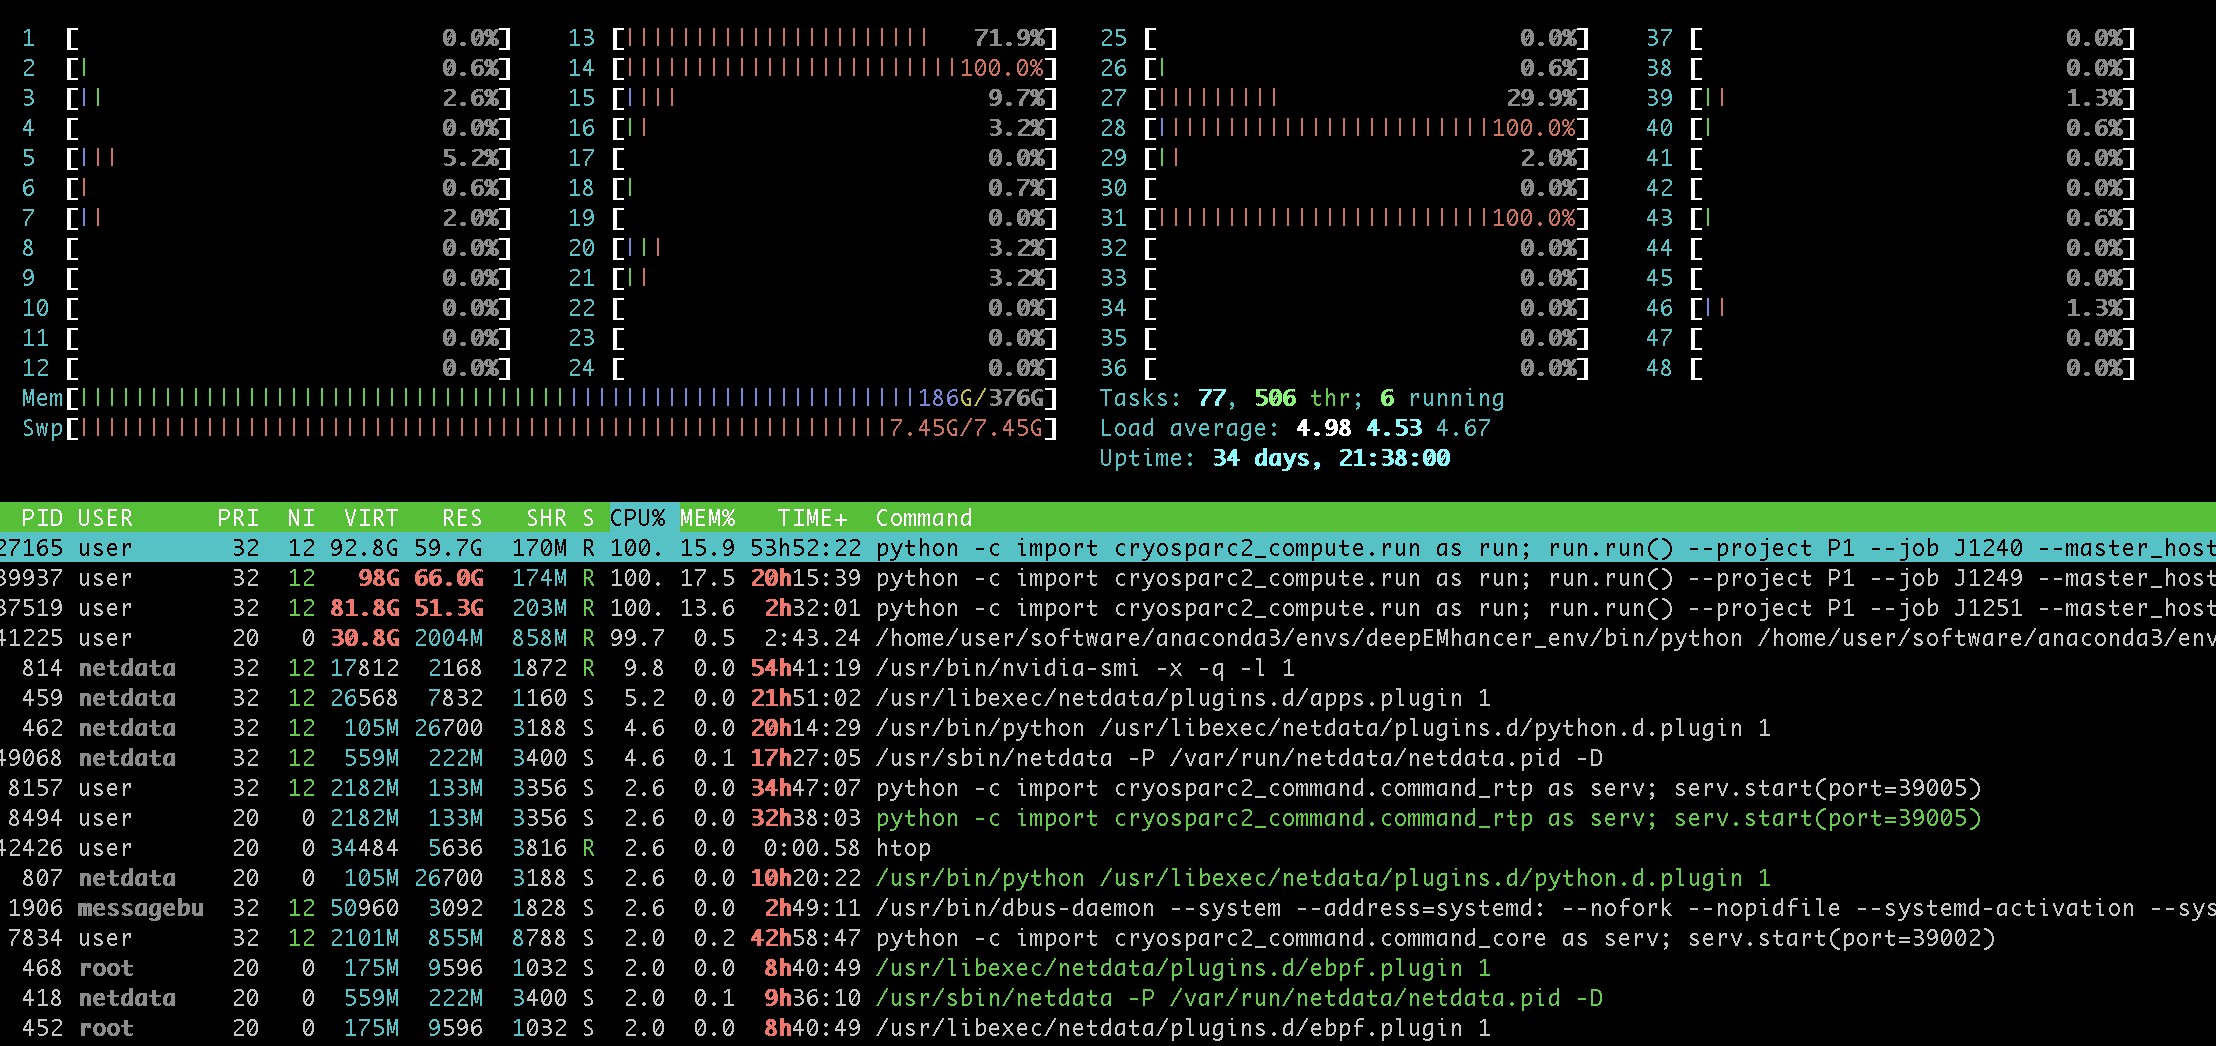
We have seen something like this before a few times and it’s been related to the operating system using system RAM for file caching. Theoretically, the OS is supposed to use empty RAM to cache recently read files and then evict those files when a process requests RAM. But for some reason, when the system is under load and there are lots of memory allocations on CPU going on (eg during FSC computation or NU-refine as you said) the OS becomes very slow at evicting cached files.
You can see if this is the case using htop. Also worth checking that the system is not swapping, to be sure.
In order to fix this, what we do is add this line to the root user crontab:
* * * * * sync && echo 1 > /proc/sys/vm/drop_caches
(you can edit the crontab by sudo crontab -e)
This causes the system to drop the file cache every minute. Bit of a sledgehammer solution but it works well every time for us.
Let us know if that helps!
1 Like
Thank you Ali I will try that immediately! This is what my htop looks like:

And re swapping:

Hi @olibclarke,
It looks like your system has as some point in the past been swapping (swap is full) but it’s the blue part of the RAM indicator that is file cache. The actual used RAM (green) is only half the system but the rest is cached files. Once you add that crontab line you should see the blue part disappear and everything should run fast again.
Another quick clue is that you see that a lot of CPUs are engaged but their usage bar is red rather than green. Green CPU means actually doing process work, red means running system calls (like evicting filecache as new memory allocations are made). So all the processes are stalled waiting for the OS.
2 Likes
Also, once you turn off file caching, you can do:
swapoff -a && swapon -a
as root. This will empty the swap area (paging back to RAM) and get the system back to fully normal.
2 Likes
Thank you @apunjani) that is extremely helpful!
It is running a lot faster now!
Is there any reason to have swapping enabled if I have enough ram (256G in this case)?
Here is the log for a run before using @apunjani’s crontab fix:

and here is a run after:

quite a difference!
Oli
Strangely, the first set of jobs I ran proceeded fine for the first iteration, but then all were marked as failed with a “no heartbeat for 30s” message - but the jobs continued, despite being marked as failed! Not sure if this is related to the modification to crontab, or if there is something else I need to alter?
Cheers
Oli
@apunjani after applying your crontab fix I am repeatedly getting these “job unresponsive, no heartbeat received for 30 seconds” error messages, causing jobs to move to failed state but continue running.
This would be fine except that then messes with GPU allocation - another job in the queue is assigned to the GPU of the “failed” job, and then both jobs fail “for real”. Suggestions welcome!
Cheers
Oli

Ok I “fixed” this by increasing CRYOSPARC_HEARTBEAT_SECONDS, as described here (Job is unresponsive - no heartbeat received in 30 second), still not sure why this error appeared after modifying the crontab
Actually @apunjani I am still persistently seeing these “no heartbeat” errors after applying your fix, even in 3.0, any advice?
Cheers
Oli
We have the same issue. Quite often now. Is there any fix for this?
Hi @david.haselbach,
Did you also add the drop_caches to crontab, and started seeing this after?
Can you also paste the output of the joblog command for this job:
cryosparcm joblog <project_uid> <job_uid>
No we haven’t tried the drop caches yet just the CRYOSPARC_HEARTBEAT_SECONDS. I will try that and see whether this fixes it.


