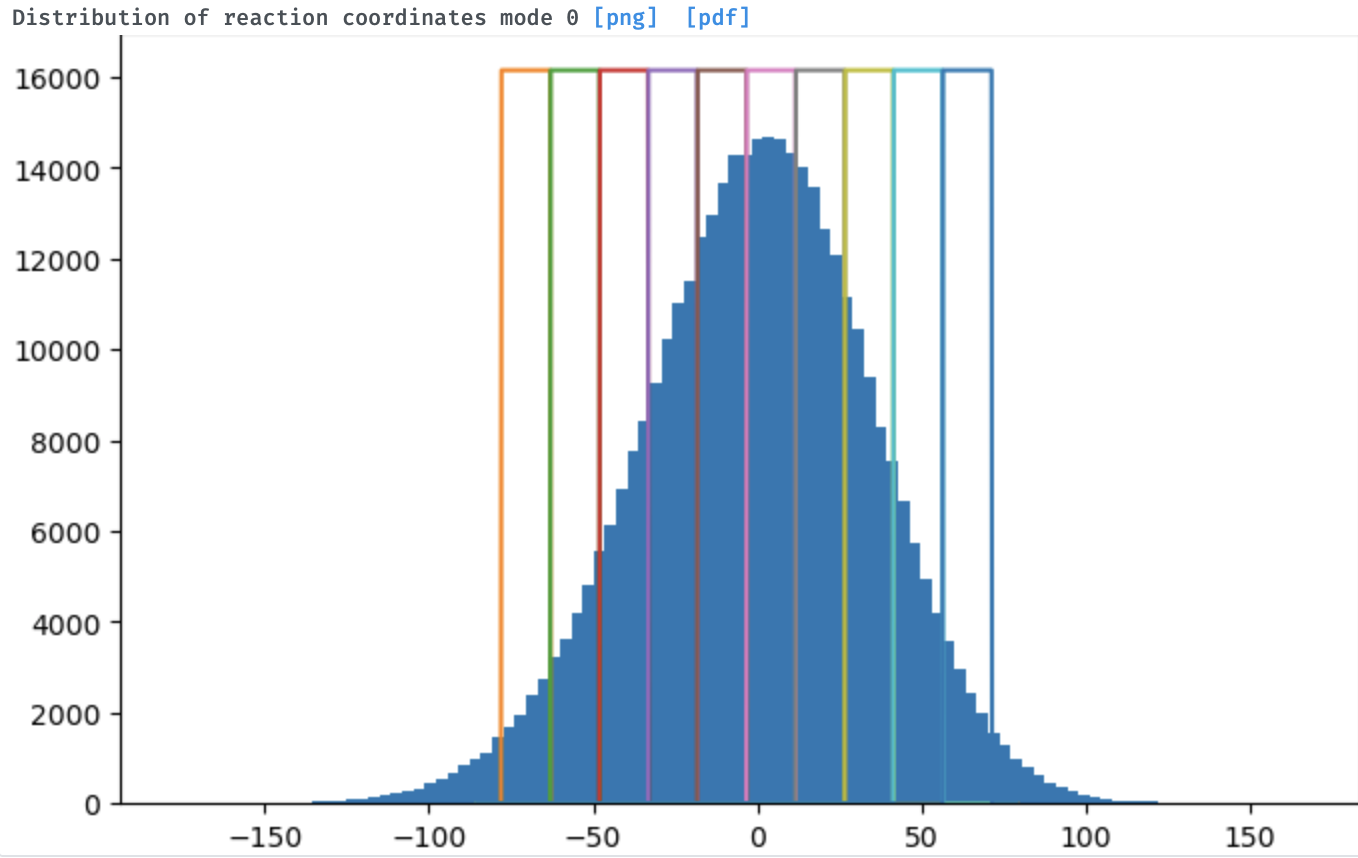
From 3D-VA I’ve identified a conformational transition - let’s say open to closed channel. When I use 3D-VA-display in “intermediates” mode, it looks like the population distribution is roughly Gaussian along the mode (see below), with the most particles in the middle, “intermediate” state, and fewer particles at either end of the transition.
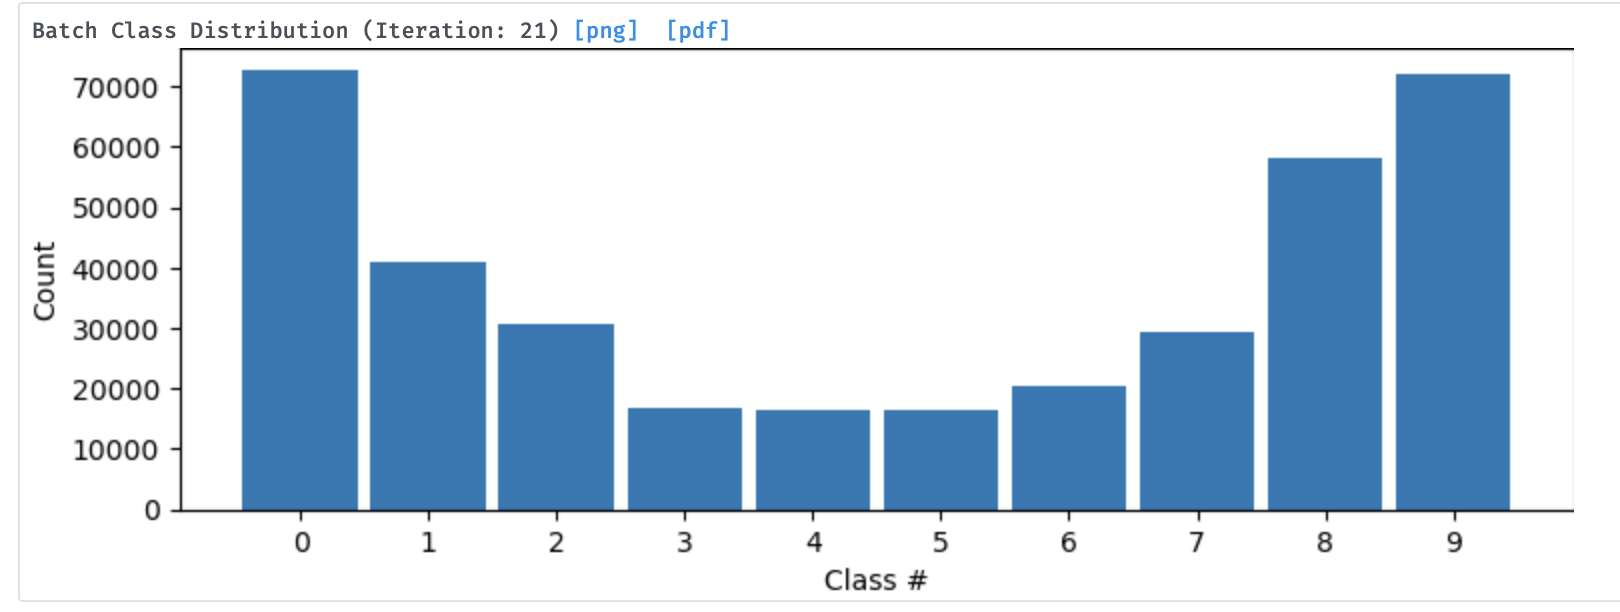
I then take the 10 reconstructions from 3D-VA display and input them to 3D-classification (beta), using the same mask and particle set as I used for 3D-VA. In this case, the population distribution appears bimodal, with both the “end states” being more populated than the middle (see below).
The results of 3D-classification make more sense to me, as I would expect the middle to be a “transitional” state and hence less populated, but I am wondering if there is any assumption underlying 3D-VA that imposes or biases towards such a population distribution?
Hi Oli,
Do the final classes still look like the 3DVA references? And do the intermediate reconstructions look like the calculated volumes from simple mode?
Yes, the final classes look comparable (in broad terms (to the 3D-VA references). I don’t usually use simple mode in 3D-VA display, so I haven’t made that comparison.
That’s a very interesting comparison of the two methods; would be great to know which one at the end works best to look into these type of transitions.
This is certainly an interesting comparison (we still need the relion results, btw). Is the 3D classification distribution still bimodal when using the consensus as input, rather than the 10 reconstructions from 3D-VA?
Have you tried to take the “intermediate/transition” classes from 3D-VA and run another round of 3D-VA or 3D classification to see what heterogeneity is left?
I haven’t compared directly with relion for this specific case. Yes, using identical classes as input gives a broadly similar distribution (though obviously the classes are not ordered like they are here, so harder to pick out by eye)
I’ve been thinking about these observations for the past couple of weeks…
I’m also seeing this same behavior initially, but across 10 final iterations, the distribution becomes nearly uniform. Without initial volumes, it seem to start out fairly uniform and stay that way.
@vperetroukhin is there any new info re class distributions in the 3D classification job? It seems like there is some sort of “equal population prior” - after many full iterations, the classes seem to tend towards equal populations in almost all cases.
This makes me concerned that it will be difficult to use this to identify rare classes without using an impractically high number of classes.
Perhaps it might be worth doing some tests with synthetic data? E.g. if one has a 95/5 split of two different conformations, can 3D classification separate them? And how many classes are required to do so consistently?