Dear all,
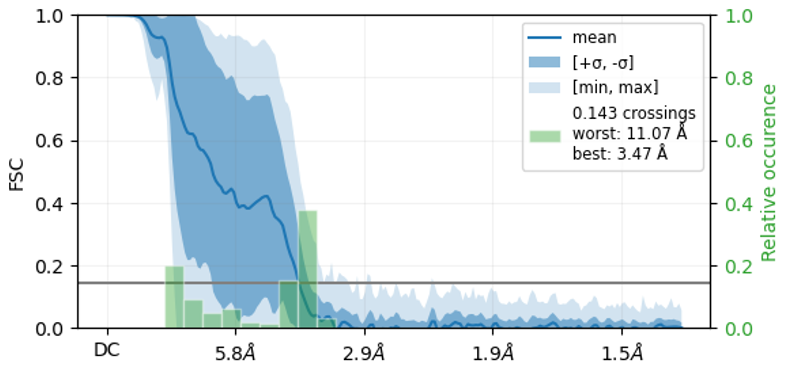
I have uploaded a plot from my Orientation diagnostic job, could you please comment about anisotropy in the data set or any other thing you may pick from the plot. My map looks good at a global resolution of ~ 5 A.
Thank you,
Dario
Dear all,
I have uploaded a plot from my Orientation diagnostic job, could you please comment about anisotropy in the data set or any other thing you may pick from the plot. My map looks good at a global resolution of ~ 5 A.
Thank you,
Dario
Hi Dario, welcome. That relative occurrence histogram (the green plot), with its almost bimodal distribution, might indicate that the particle appears in two dominant orientations but one has decent resolution and the other has poor resolution. My memory is foggy but I may have seen this sometimes when combining tilted and un-tilted datasets - while the tilt provides more of a previously rare view, its resolution is hurt by imaging through more ice. That’s one thing that jumps out to me from your plot.