Hi all,
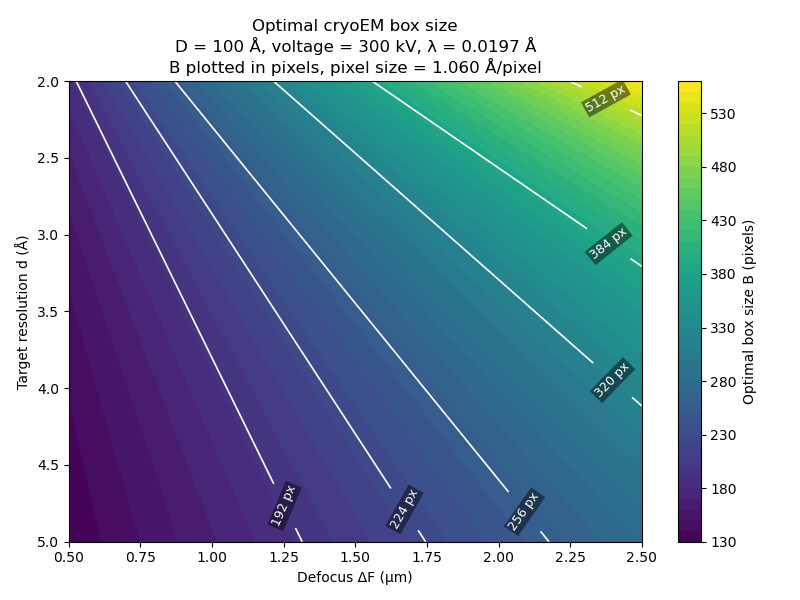
I made a little widget for plotting the Rosenthal & Henderson optimal box size - a conservative estimate of how big your box needs to be to capture all information at a given resolution:
Gives plots like this:
& with the --box-size argument shades region affected by CTF aliasing:
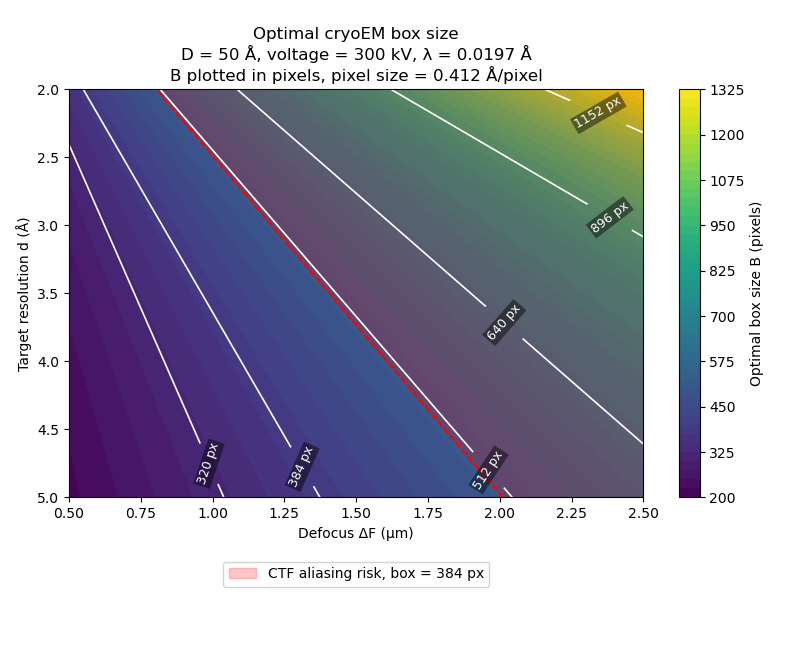
Which may be helpful when planning data collection or processing.
Cheers
Oli