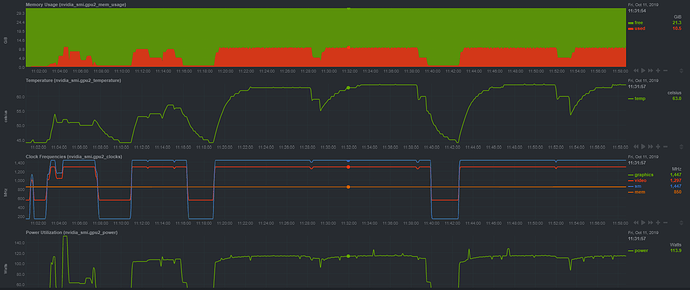
When running cryoSPARC, it can be valuable to keep track of your worker instance’s hardware statistics to understand more about the resource usage of a job. In particular, monitoring the utilization of GPUs running cryoSPARC jobs can give insight into ‘out of memory’ errors.
The integrated tools to monitor hardware in Linux are somewhat lackluster - that’s why we recommend Netdata, an open-source tool:
Netdata is distributed, real-time, performance and health monitoring for systems and applications . It is a highly optimized monitoring agent you install on all your systems and containers.
Netdata provides unparalleled insights, in real-time, of everything happening on the systems it runs (including web servers, databases, applications), using highly interactive web dashboards . It can run autonomously, without any third party components, or it can be integrated to existing monitoring tool chains (Prometheus, Graphite, OpenTSDB, Kafka, Grafana, etc).
By default, Netdata comes with an interactive web dashboard, making it easy to monitor an instance remotely by creating an SSH tunnel on your local machine. Click here to learn more about Netdata.

Above: Netdata dashboard (via Netdata GitHub)
Installing Netdata
Please follow the installation guide on the Netdata documentation for instructions.
Enabling GPU Monitoring
By default, the integrated GPU monitoring capability in Netdata is disabled. As long as your machine has nvidia-smi available, you can enable it:
cd /etc/netdata./edit-config python.d.conf- Remove the hash in this line:
nvidia_smi = true - Save the configuration file
service netdata restart
Above: Viewing GPU memory usage, temperature, clock frequency and power draw while running a refinement job in cryoSPARC
Additional Netdata Documentation
Netdata is a highly configurable tool - we recommend reading through the documentation to take advantage of it’s other capabilities such as backing up data to persistent storage or monitoring certain conditions (for example, high CPU usage) with real-time notifications. Click here to view the documentation.
