I have a map that may have reached the Nyquist limit, and I am utilizing default parameters for local-resolution analysis. The majority of sites on the map display a single color and value (the curve represents a resolution of 2.2A, while the color indicates 2.5A). What could be the cause of this condition?
@Yuefan Which program did you use for the local resolution analysis, and what non-default parameters did you apply?
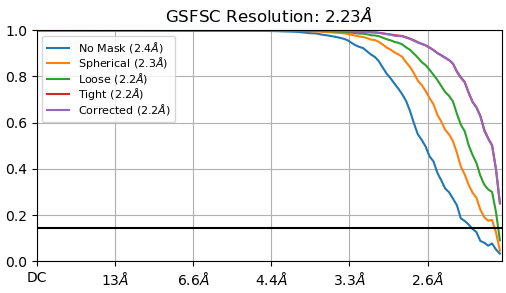
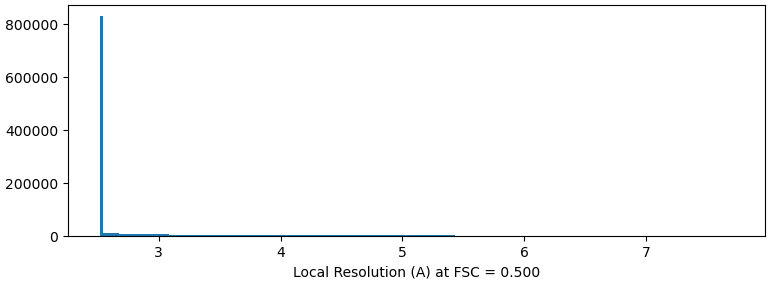
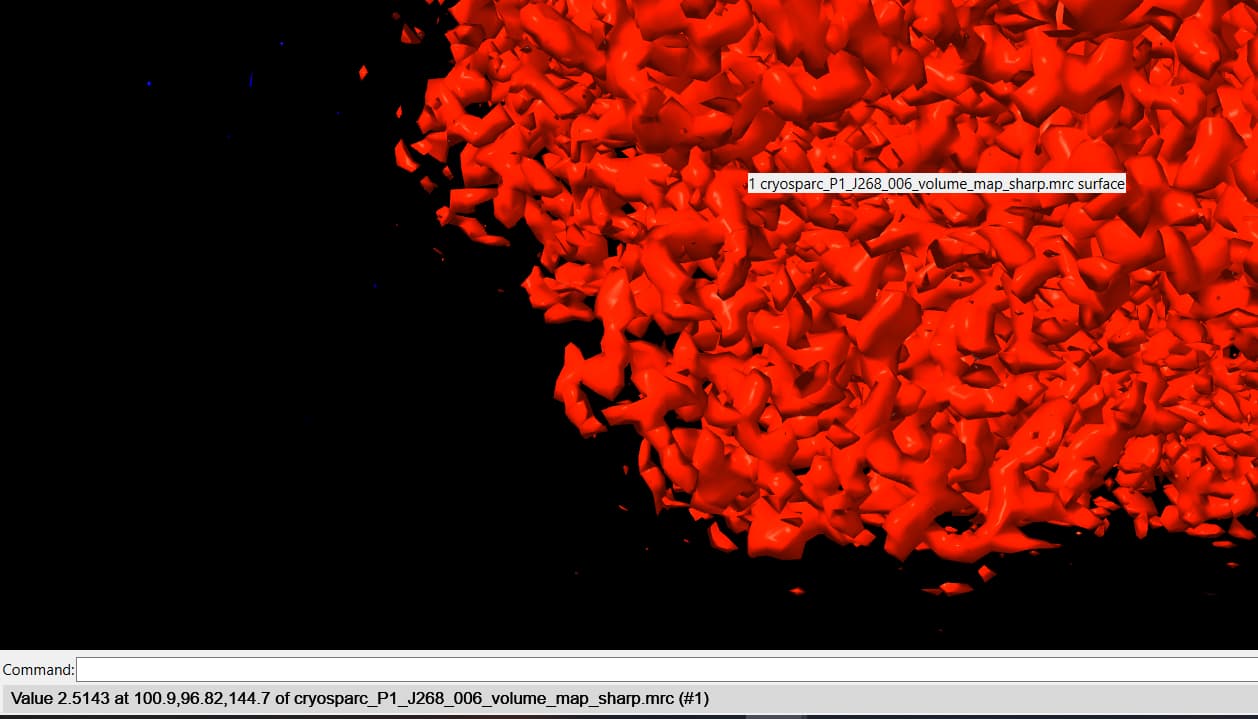
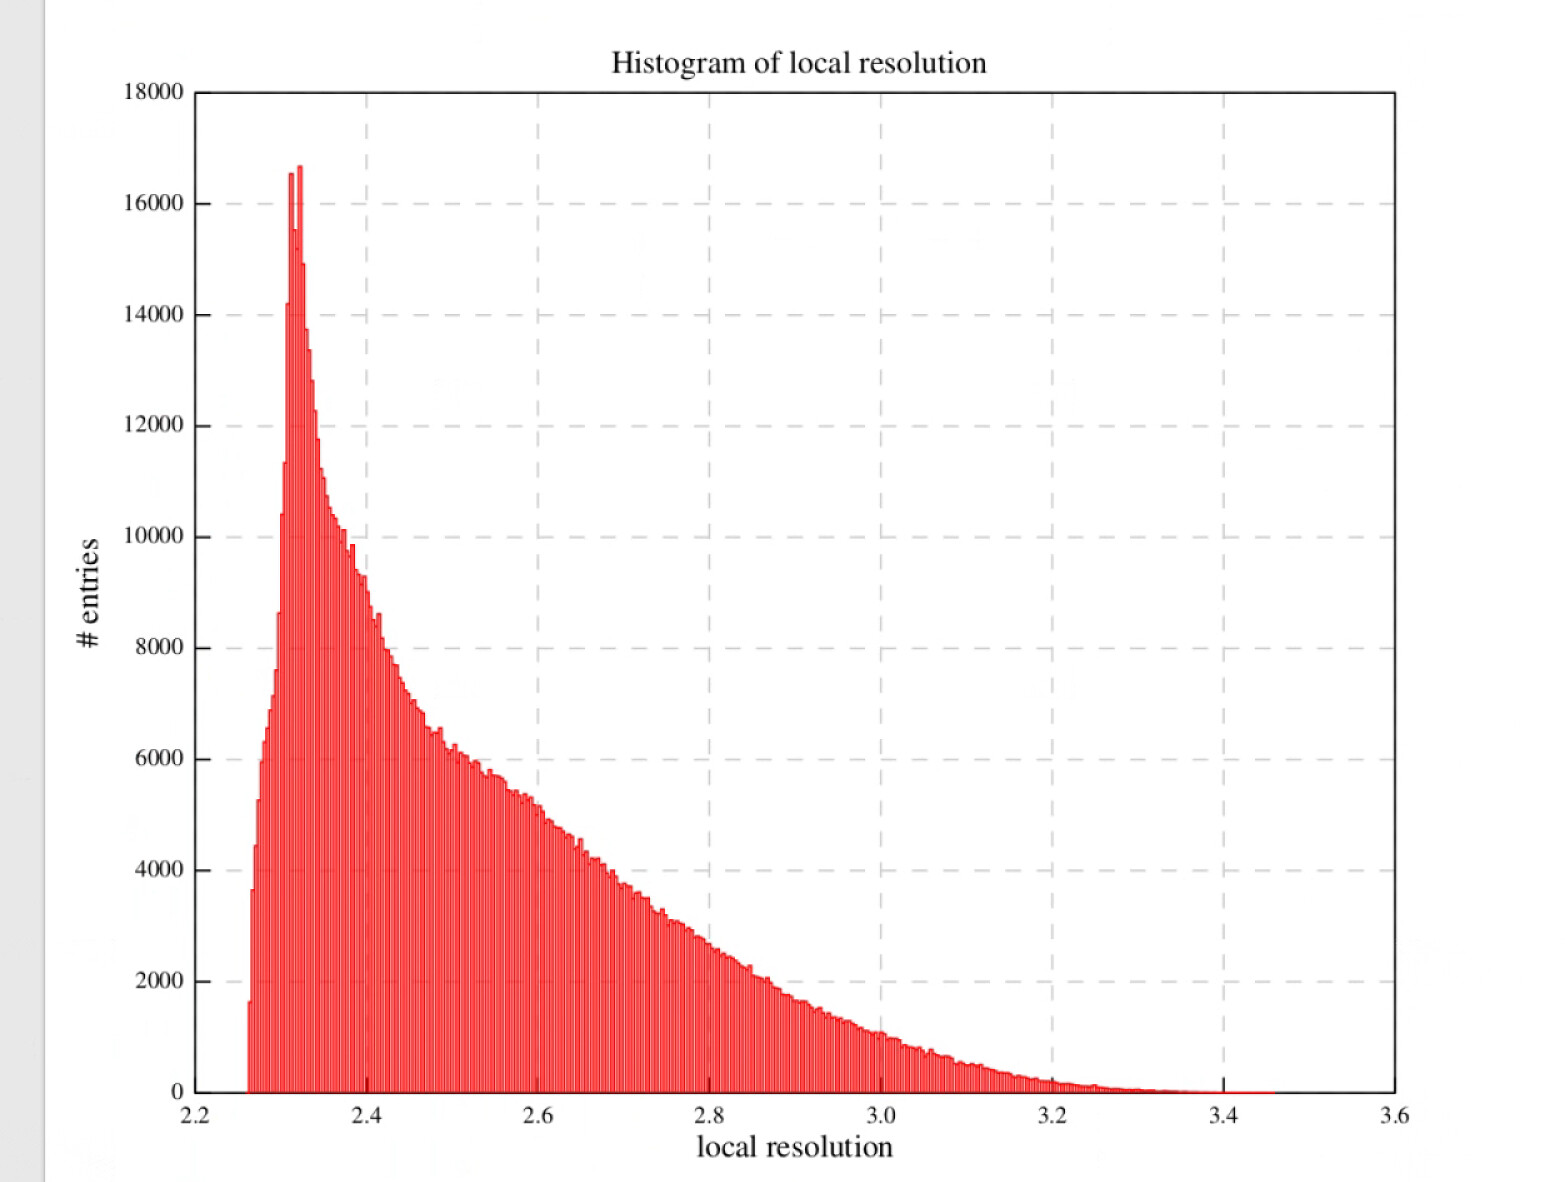
After applying NU-Refine with D4 symmetry (while keeping other parameters at their default values), I conducted local Resolution Estimation directly in Cryosparc using the default settings. The pictures displayed below are the curve and local resolution values histogram. In ChimeraX, I adjusted the threshold level and observed some noise points indicating a resolution of 2.2A. However, the protein itself appears as a single color with a resolution value of 2.5A.
@Yuefan Have you applied any downsampling or binning to exposures or particles?
Also note that the default FSC cut-off for the Local Resolution Estimation job type is 0.5, but can be adjusted with the job’s FSC threshold parameter. A threshold lower than 0.5 may have been applied to obtain
GSFSC Resolution: 2.23Å
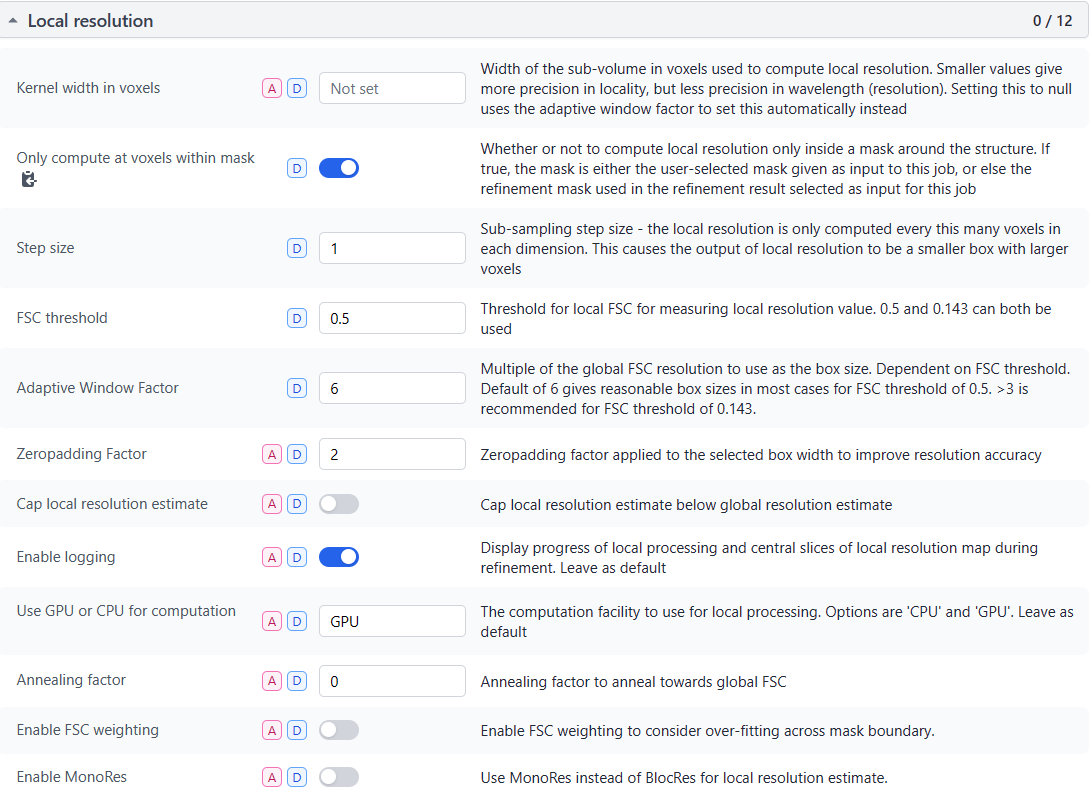
I have not applied binning or downsampling to this exposures or particles. The raw pixel size of raw movies is 1.1. The pictures displayed below is screenshot of my parameter which is default. Thank you very much.
Then you either have duplicate particles artificially boosting your FSC, or your sample is a really good one and hit Nyquist.
If you have a TFS Falcon 4(i) (and collected in EER) you can resample to 8K to get past that limit, or, if using any other detector, you can try out PASR. ![]()
Hi @Yuefan,
Thanks for sharing this. As @rbs_sci mentioned, you likely have hit the Nyquist limit with this sample and exploring PASR might be an appropriate next step if you did not collect in EER format.
RE: local resolution - This job defaults the FSC threshold to 0.5 and since your sample, by GSFC resolution, is better than 2.5A, you will not see a distribution of local resolutions if those resolutions are higher than 2.5A. I would suggest setting this parameter to 0.143 such that it matches the threshold used for GSFSC calculations.
Best,
Kye
Thank you for your advice. Compared to the default parameters, I tried modifying the FSC threshold to 0.143. It did not make any improvement.
After that, I turned on the ‘Cap local resolution estimation’ function and set 0.143 FSC threshold. The resolution of log reports has been improved this time which is near the global curve.
But when I look at it in chimera, the resolution on the protein is still only a value of 2.514. The noise around the protein shows a resolution of 2.308.
Then I tried to input the half map, mask in the refine result and the b-factor in the log as the local res of relion. At this time, a more reasonable resolution distribution was obtained in relion. why is that?
Hi @Yuefan,
Thanks for the update, we have noted the behaviour you have described and have reproduced it by downsampling a test dataset such that it hit nyquist. One thing we found that helped to improve this was increasing the ‘Adaptive Window Factor’ parameter to a much higher number (something along the lines of 36 worked well in our test case with all other parameters left at defaults). I would recommend varying that parameter to see if you see improvement. Otherwise, as @rbs_sci mentioned, it might be a good option to use PASR as an approach to get past nyquist.
Cheers,
Kye
2 Likes
And to reiterate, original repo here:
![]()
1 Like