Hi @huqi,
Just to clarify - are you looking for the best way to visualize the local resolution of a protein structure that you have passed through a Local Resolution Estimation job? The easiest way to visualize the actual local resolution values would be to use UCSF Chimera.
Specifically, you can
- Download the sharpened map from whichever refinement you are considering, as well as the
map_locresvolume output from the Local Resolution Estimation job. - Open both volumes in UCSF Chimera
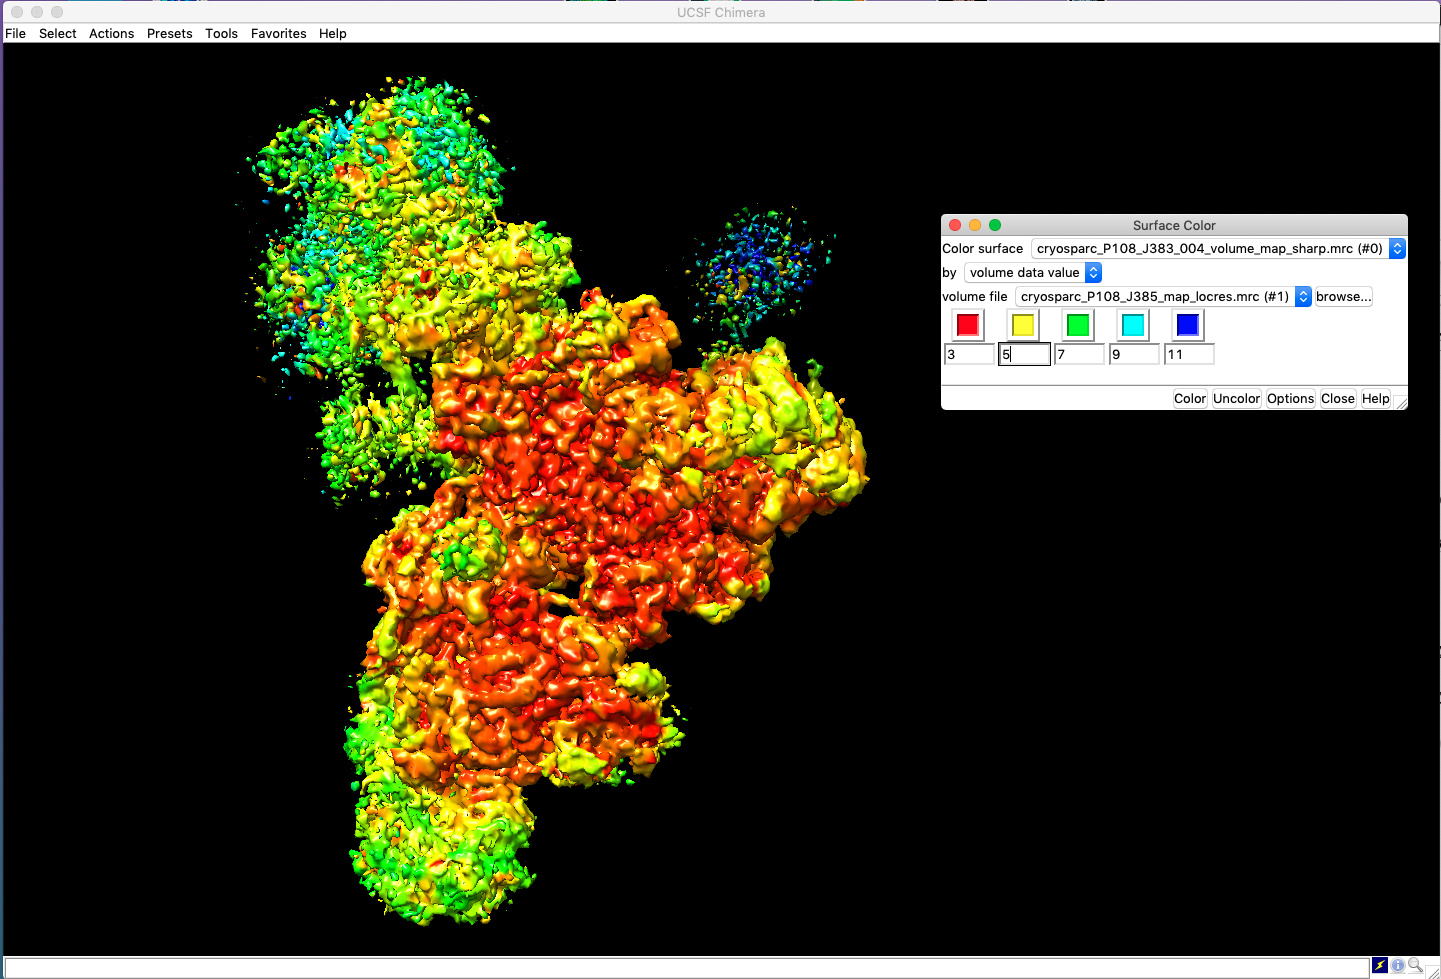
- Select the volume corresponding to the actual sharpened map, and then click Tools > Surface Color
- Change the settings to color the sharpened map by “volume data value”, and for the volume file, select the
map_locresmrc file that you downloaded. - Click “Color”. You can also manually change the values assigned to each color sample
Here’s an example of the Surface Color dialog box next to the map, colored by resolution:
Let me know if this answers your question, or if you need any clarification! You can also find more information in this post: View coloured 3D map in Chimera using output from local resolution
Best,
Michael