Hi, I have a very basic question about local resolution. How can I read the values of the resolution range?
Thank you for any comments.
Qi
Hi, I have a very basic question about local resolution. How can I read the values of the resolution range?
Thank you for any comments.
Qi
Hi @huqi,
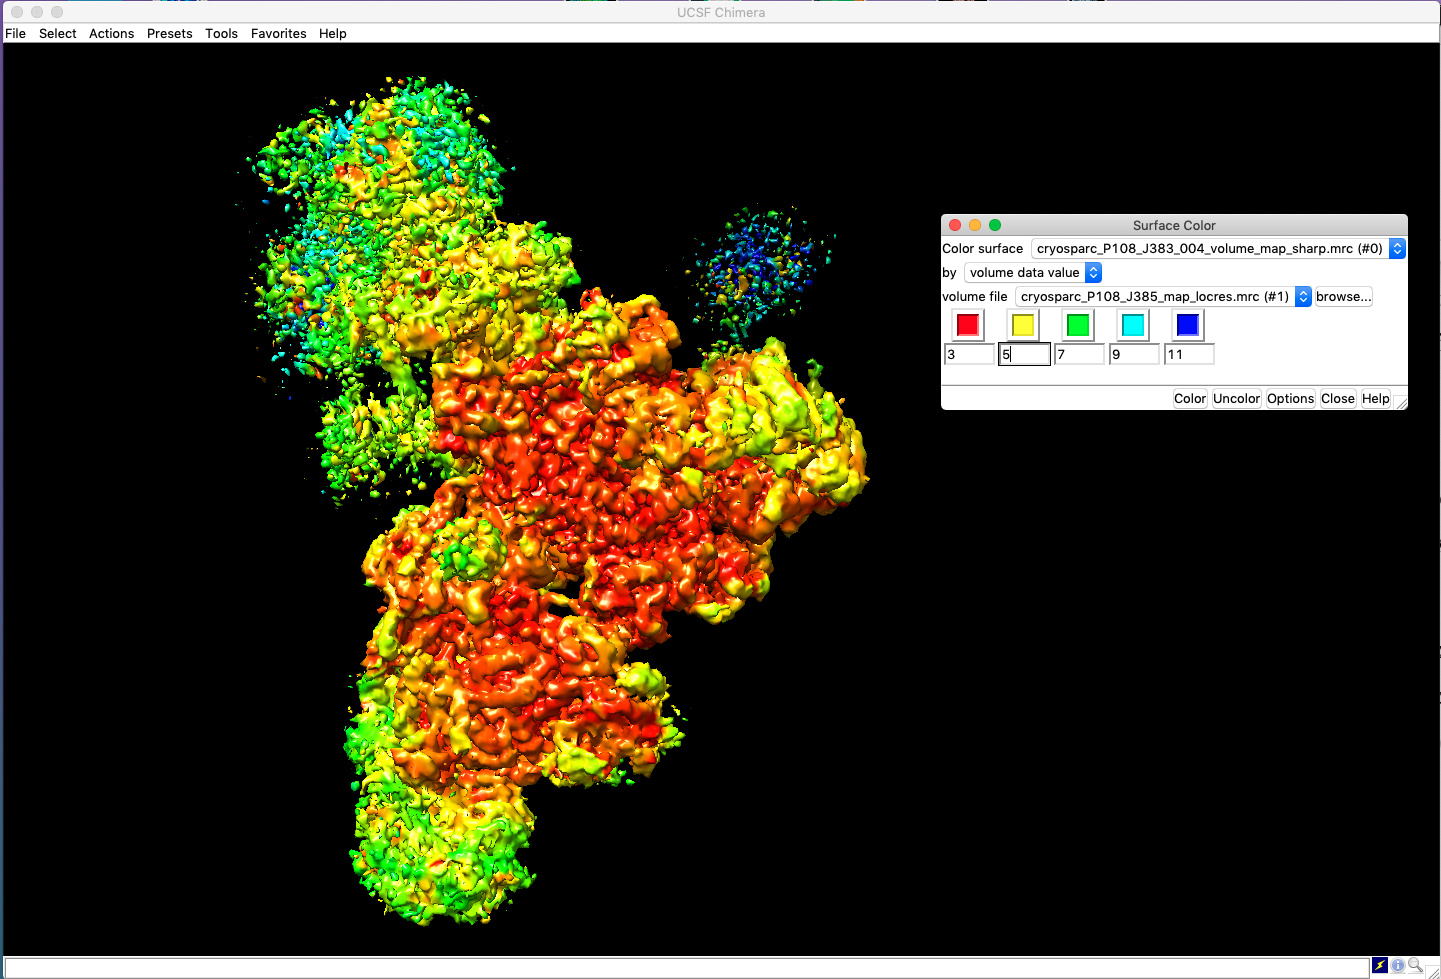
Just to clarify - are you looking for the best way to visualize the local resolution of a protein structure that you have passed through a Local Resolution Estimation job? The easiest way to visualize the actual local resolution values would be to use UCSF Chimera.
Specifically, you can
map_locres volume output from the Local Resolution Estimation job.map_locres mrc file that you downloaded.Here’s an example of the Surface Color dialog box next to the map, colored by resolution:
Let me know if this answers your question, or if you need any clarification! You can also find more information in this post: View coloured 3D map in Chimera using output from local resolution
Best,
Michael
Hi @mmclean,
Thank you very much. Besides that, I wanted to obtain the values of resolution range (XX-XX A) that can be used in the table in a publication. I noticed some publications report such ranges but not sure how to get it. By visualizing in Chimera, I can see resolution values displayed in for different regions. Though these values change when I change the display level. So still not sure what values to report.
Best,
Qi
Hi Qi, if you look in Chimera at the map histogram for the local resolution volume, this will give you the range of measured local resolution values.
Whether the min/max of this distribution is the best thing to report in a publication is not clear to me, as the min/max will strongly depend on the mask.
I tend to advocate for reporting the min/max local res values measured at model atom positions, which you can get using the “Values at atom positions” tool in Chimera - to me this seems more useful information for interpreting how good the map is in regions that were actually modeled.
Hope that helps!
Cheers
Oli
In crystallography, there is a beam stop that physically high-pass filters the diffraction data, and a cutoff frequency when taking diffraction spots, so the map resolution range is well defined.
However, in single-particle analysis the “map resolution range” is from Nyquist (2 * pixel size) to the lowest frequency (2 * pixel size * box size), unless you have band-pass filtered the map. A more useful definition might be the range of local resolution values within the FSC mask, but this hasn’t been widely agreed on (or discussed).
Likewise, the “model resolution range” could be defined as the range of the local resolution values sampled on the atomic coordinates, but there’s no consensus in the field about it.
In practice, editors will allow you to leave the table entry blank or accept whatever values you provide. If you look at publications, you will see that most of them list what can only be arbitrary values chosen by the author. Please don’t do that, but any of these other options is reasonable at the moment.
Hi @DanielAsarnow - I wonder if one could define the map resolution range as the min/max/mean of local resolution values measured at atom positions, and define the model resolution range similarly, but using a map/model local FSC - so a local res job but with calc map and experimental map rather than two half map inputs? would perhaps provide useful info about the variation in model quality.
Agree that these parameters are currently mostly left undefined and somewhat haphazardly filled out in many publications. More stringent (or at least consistently defined) definitions would be useful.
Thank you very much for your answers @olibclarke@DanielAsarnow. This is very helpful.
@olibclarke @DanielAsarnow thanks for the useful info. i have a question, how do you read the resolution range by doing what you describe by using the Values at atom positions” tool in Chimera ? These values need to be converted in Angstrom. Another question: from where do you get the values of the model resolution range ? I don’t see this entry in the table1 generated from Phenix. Many thanks
Hi Jacopo,
The local resolution map has local resolution values in Angstrom at each voxel. Using “Values at atom positions” creates an attribute in Chimera where the local resolution has been assigned as an attribute of each atom (or residue). A range can then be inspected in the “Render by attribute” tool. Does that make sense?
As discussed above, the model resolution range is not a well defined parameter - I would either leave this blank, or very explicitly describe what you are doing for this value in the methods.
Cheers
Oli
Hi @olibclarke , many thanks. I see that the meaningful values are essentially those that go from regions where you see sidechains to those regions at lower resolution but that still allow to model secondary structure elements. I am not sure people extend this range to low resolution values for elements like a micelle, correct ?Many thanks again and best wishes