Local refinement memory error with NU-refinement ON and Fulcrum coordinates

Hi, I am getting “memory error” at Iteration 17 when I run local refinement for 400px box with NU-refinement on and Fulcrum coordinates. The same job w/o Fulcrum coordinates was completed properly. Also, the similar jobs with different volume and mask with NU-refinement ON and Fulcrum coordinates were successfully completed. was completed. I’m using v2.14.2 (24 cores, 64GB RAM, 2GPUs with SSD). Could somebody help me solve this issue?

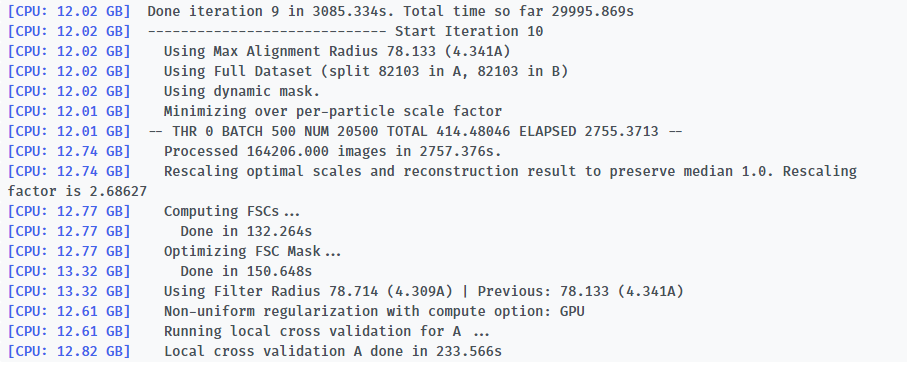
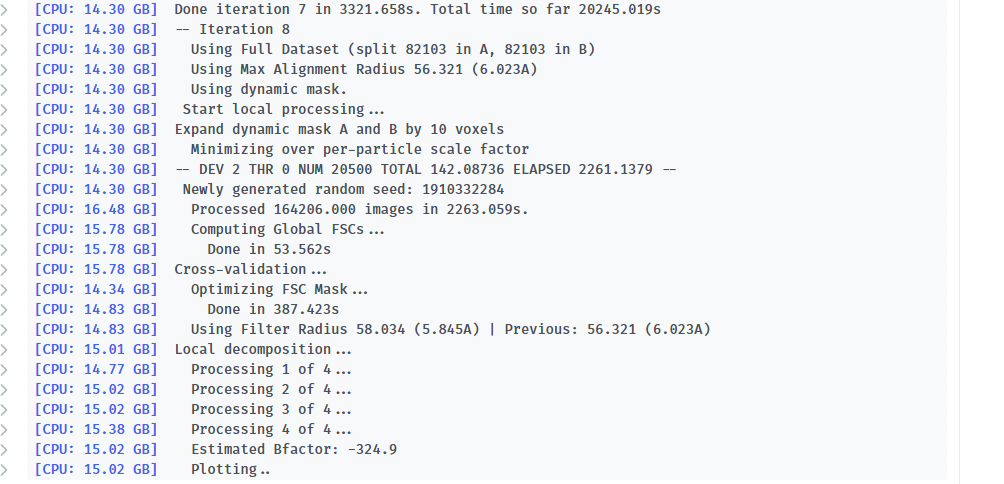
Here is the log of Iteration 17 and the error message.

-- Iteration 17
[CPU: 48.33 GB]    Using Full Dataset (split 50316 in A, 50316 in B)
[CPU: 48.33 GB]    Using Max Alignment Radius 112.437 (3.664A)
[CPU: 49.29 GB]    Using previous iteration scale factors for each particle during alignment
[CPU: 49.29 GB]    Current alpha values  (  1.00 |  1.00 |  1.00 |  1.00 |  1.00 ) 
[CPU: 49.29 GB]    Using best alpha for reconstruction in each iteration
[CPU: 49.29 GB]  -- DEV 0 THR 1 NUM 12658 TOTAL 87.310928 ELAPSED 358.76506 --
[CPU: 52.14 GB]    Processed 100632 images in 4562.842s.
[CPU: 52.62 GB]    Computing FSCs... 
[CPU: 52.62 GB]      Done in 48.447s
[CPU: 52.62 GB]    Optimizing FSC Mask... 
[CPU: 38.99 GB]  Traceback (most recent call last):
  File "cryosparc2_worker/cryosparc2_compute/run.py", line 82, in cryosparc2_compute.run.main
  File "cryosparc2_worker/cryosparc2_compute/jobs/local_refine/run.py", line 586, in cryosparc2_compute.jobs.local_refine.run.run_naive_local_refine
  File "cryosparc2_compute/sigproc.py", line 1025, in find_best_fsc
    tight_near_ang=near, tight_far_ang=far, initmask=initmask)
  File "cryosparc2_compute/sigproc.py", line 1001, in compute_all_fscs
    radwns, fsc_true, fsc_noisesub = noise_sub_fsc (rMA, rMB, mask, radwn_noisesub_start, radwn_max)
  File "cryosparc2_compute/sigproc.py", line 823, in noise_sub_fsc
    fMBrand = fourier.fft(fourier.ifft(randomphases(fourier.fft(MB), radwn_ns)) * mask)
  File "cryosparc2_compute/fourier.py", line 110, in fft
    return fftcenter3(x, fft_threads)
  File "cryosparc2_compute/fourier.py", line 74, in fftcenter3
    fv = fftmod.fftn(tmp, threads=th)
  File "/home/owner/cryosparc2c/cryosparc2_worker/deps/anaconda/lib/python2.7/site-packages/pyfftw/interfaces/numpy_fft.py", line 183, in fftn
    calling_func, normalise_idft=normalise_idft, ortho=ortho)
  File "/home/owner/cryosparc2c/cryosparc2_worker/deps/anaconda/lib/python2.7/site-packages/pyfftw/interfaces/_utils.py", line 125, in _Xfftn
    FFTW_object = getattr(builders, calling_func)(*planner_args)
  File "/home/owner/cryosparc2c/cryosparc2_worker/deps/anaconda/lib/python2.7/site-packages/pyfftw/builders/builders.py", line 364, in fftn
    avoid_copy, inverse, real)
  File "/home/owner/cryosparc2c/cryosparc2_worker/deps/anaconda/lib/python2.7/site-packages/pyfftw/builders/_utils.py", line 186, in _Xfftn
    input_array = pyfftw.byte_align(input_array)
  File "pyfftw/utils.pxi", line 96, in pyfftw.pyfftw.byte_align
  File "pyfftw/utils.pxi", line 130, in pyfftw.pyfftw.byte_align
  File "pyfftw/utils.pxi", line 172, in pyfftw.pyfftw.empty_aligned
  File "pyfftw/utils.pxi", line 201, in pyfftw.pyfftw.empty_aligned
MemoryError

Hi @menmt,

Is there any chance some other process is using some CPU RAM while you are running the job? The CPU RAM requirements for the cases you described should be the same, so if the job completed sometimes successfully, there is enough memory in the system I believe.

Hi apunjani,

No other process is using CPU RAM… CPU RAM required varies from 40-60GB depending on a masked region. Smaller masks seem to use more CPU RAM.

@menmt unfortunately local refinement (and non-uniform refinement) both have not been thoroughly mmemory optimized yet so there is not likely much we can do at this point. If you dont need to refine at the full resolution of your images, you could try to use “downsample particles” or change the “refinement box size” in the refinement job to downsample the particles on the fly and use less memory in total.

I need the full resolution, so will try a smaller box size. I wonder what is the fastest way to change the refinement box size. Apparently there is no option to change the refinement box size in local refinement job. Do I have to redo particle extraction with a smaller box size???

Hi @menmt,

In order to change the extracted box size (and keep the same pixel size/resolution as you desire) you will have to run particle extraction again - you may have already figured this out. Hope it’s working well!

Yes, I’ve already done the same way and RAM usage was significantly decreased with 350px box size. Thank you for your help!

Hi @apunjani
I am having a similar issue as described here although without an error - the run is just very very slow. My box size is 540pix at 1.06apix for 80k particles and I suspect that this is causing cpu memory issues. GPU memory is fine on the RTX5000 GPU. Has non-uniform refine perhaps been memory optimized in the newest release of cryosparc? Also, I can’t find the option to decrease the ‘refinement box size’ in the NU refine GUI. Is this not possible? Would I have to reextract instead?

Hi @lizellelubbe,

Are you running into errors in the local refinement job, or the non-uniform refinement job? As well, are you running the legacy or new version? With regards to the slowdown, I would ask where in the job are you seeing the most slowdown – for a typical iteration, most of the time would be spent either in the alignment/backprojection process, cross validation, or in FSC computation. Could you check the stream log for the last iteration and show the times for the following steps?

  • “Processed __ images in x seconds.”
  • “Computing FSCs… Done in z seconds”
  • “Local cross validation A done in y seconds” (if using the legacy NU-refine, I don’t think this part is timed)

This might help us see if the slowdown is related to the GPU or CPU processing. There’s also been reports of a similar slowdown in the new local refine/NU-refine job (Local refinement (new) error), and seemingly a system restart helped alleviate the issue, which could help in this case (but it would be helpful to first check the GPU’s status using nvidia-smi to make sure there aren’t other processes using memory).

Best,
Michael

Hi @mmclean
Thank you so much for the reply! I am really confused about what is going on with my refinements and don’t know what is wrong. At the time of my previous post, I was trying to run the new non-uniform refinement job. I have since tried a number of things to try and improve the run time but had no luck. I am using cryosparc v3.1.0 on a machine with 48 cores, 256GB memory and 4 Quadro RTX5000 GPUs.

Non-uniform refine (new) with 137 898 particles in 540pix box at 1.06apix (ran on 7 March):

  • I saw that it was running on /home which is slower and so killed it during iteration 0

Non-uniform refine (new) with 137 898 particles in 540pix box at 1.06apix after moving CS project to /data which is meant to be faster (ran on 8 March):

  • no difference between /home and /data for iteration 0

  • For the last iteration:

  • the last iteration was even slower and job eventually completed in a total time of 140 955.77s

On 4 March I ran a homogenous refinement on 405k particles in 540pix box at 1.06pix which was also slow (131 656.11s to complete the job) but I thought it might be due to the large amount of particles used:

Yesterday, I looked back at a non-uniform refine (new) job from 3 March and saw that it completed in much less time (total run time of 12 310.26s for 10 iterations). Box size was 320pix at 1.06apix with 164 206 particles.

I thought that the box size of 540pix was the problem and therefore decided to go back to this job from 3 March to optimize the dynamic mask parameters. When I ran using the same parameters and input as on 3 March (320pix box at 1.06apix with 164 206 particles) but just a wider mask setting, however, the run was just as slow as with the 540pix box.

I therefore created a clone of the previous (fast) job from 3 March and ran that yesterday. Using the exact same parameters and input as before, the job was much slower (total run time of 33 589.57s vs ~12k seconds for 10 iterations):

I wondered if the legacy version of NU refine may give a different run time and therefore used the input for the last job above as input to Non-uniform refinement (legacy):

  • I haven’t used the legacy version before but it seems to take roughly the same time as the New version (total run time of 24 518.84s). The NU refine (New) code is meant to be faster, right?

I checked top and nvidia-smi while the last (cloned) NU refine (New) job was running on gpu0 and couldn’t see any suspicious activity that was draining cpu or gpu (there was just another cryosparc job running on gpu1 at the same time):

nvidia_smi_9March

I haven’t tried to restart the PC yet - is that the only option Michael, or do you see a clue in the streaming logs as to what is wrong? To me, it looks like my data and parameters aren’t really causing it to slow down (although 540pix box is slower) but something happened between 3-4 March since repeating the exact same thing is giving different run times. The computer has been up since 25 February and the last installation of a new program was made on 1 March.

As a further update, I have tried restarting cryosparc (which yielded no improvement) and also rebooted the PC. The latter also gave no improvement although no other processes were running on top or nvidia-smi.

We have now reinstalled cryosparc as a last resort and I ran the same NU refine (new) job again.
For the first iteration it takes ~600s to read the images while it took ~40s last week so reinstalling didn’t help.

As before, not much is happening on nvidia-smi and htop (apart from cryosparc) so I don’t know why it is slower:

Hi @lizellelubbe,

Thanks for the very detailed information! Based on the timings and htop output, the slowdown is likely related to file reading. From htop it looks like you’re using sshfs to mount a remote directory – are the particle images, project directory, etc. located on the remote filesystem? Perhaps network connectivity could explain the runtime variability?

Also some other questions:

  • were the jobs running with SSD caching enabled?
  • could you let us know what OS the system running cryoSPARC is on?

Best,
Michael

Hi @mmclean

I was told that cryosparc was not built on our PC with the SSD caching option since we are using the SSD to cache the ZFS so that the filesystem should be fast. I am using sshfs to mount a remote directory, yes, but the two PCs are on a 10Gig link so we thought that it shouldn’t affect the runtime. Maybe you are right and I am unlucky to be hitting some network connectivity issues this week.

The reason why I didn’t move my data directly onto the PC used for processing was because I did a lot of processing in Relion using that remote directory. I was afraid of running into issues with paths inside of Relion .star files if I moved all my data over to the processing PC. I imported a particle stack created by Relion Extract into cryosparc and saw that even after import, cryosparc still requires the remote directory containing the Relion Extract directory to be mounted.

Do you think it would be alright to move the entire Relion project directory across (7.9TB)? I couldn’t manage to link my micrographs when importing particles into cryosparc so expect that I would need to go back at times and re-extract using Relion.

Our OS is Ubuntu 20.04.2 LTS

Hi @lizellelubbe,

I suspect that sshfs is the culprit, it is known to have performance issues and is not a configuration that we test or support. If you can, I would recommend switching to NFS instead. if the two machines have a 10Gb link, the performance should be very good.

– Harris