This is quite odd; we have not seen this behaviour before. Can you confirm the statuses still show differently even after restarting your browser or refreshing the page? If possible, could you include the final few lines of each job log?
Refreshing the page, or creating and accessing from a new browser window did not help.
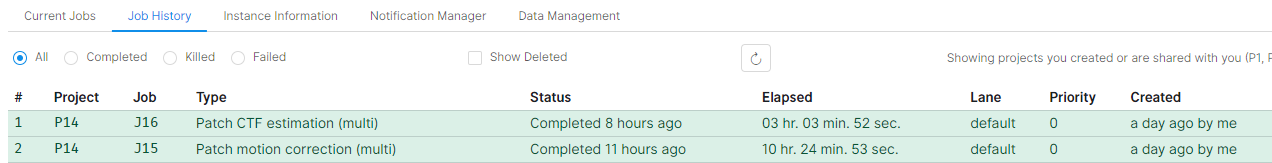
After killing all the browser processes and start a new browser, the job statuses are now both completed.
(I’m using google chrome v92.0.4515.131 Windows 10)
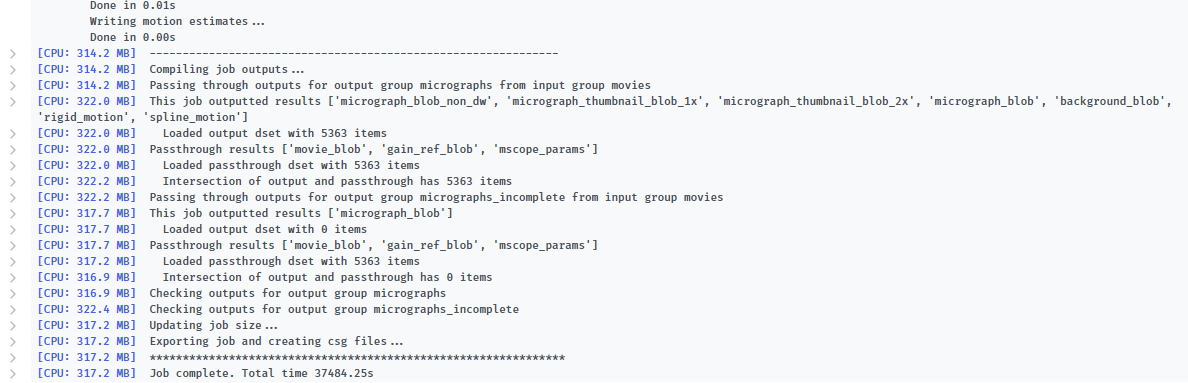
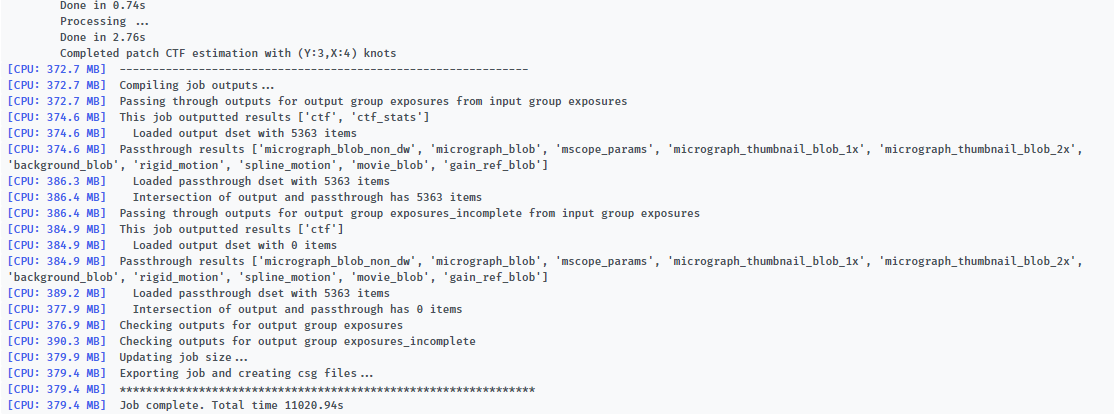
Here are the final few lines of the two logs. Nothing strange.
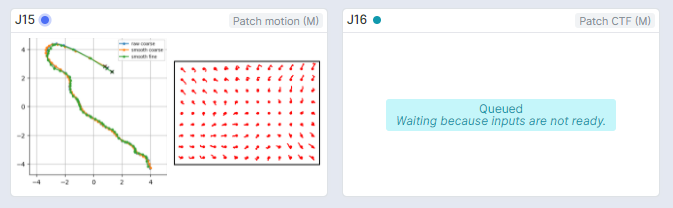
I forgot to mention but the logs were already ‘completed’ as below even before the statuses are updated.
Other than this, I am also suffering from some strange behaviors these days.
Once I logout of cryoSPARC, it is impossible to re-login. Pressing Log In button doens’t show anything
Job progresses (in a overview tab) tend to be not updated in real time. The progresses can be updated only by manually refreshing (F5) the page (or, sometimes not updated even by refreshing)
We are using cryoSPARC in cluster mode, and another user is also having similar experiences.
Thank you for the additional information. One possibility is a network rule or firewall preventing certain data from reaching the web application? If possible, whenever you encounter another discrepancy like this please reply with the output of cryosparcm log webapp.
Turning off the firewall, or accessing from the local computer (the cryosparc master server), doesn’t change the situation.
The following is a log while I was attempting to connect a particle group to the input of another job. It appeared to be successful in the log, but the screen did not reflect it unless I manually refreshed the browser.
[PUB] job.events: { project_uid: 'P14',
  job_uid: 'J53',
  created_at: { '$gt': 2021-08-19T21:35:07.134Z } } 100 0
[PUB] events.countAfterCheckpoint
job_connect_group
{"project_uid":"P14","source_group":"J53.particles","dest_group":"J54.particles"}
job_connect_group
{"project_uid":"P14","source_group":"J53.particles","dest_group":"J54.particles"}
{ code: 500,
  data: null,
  message: 'OtherError: Repeatedly connecting output group J53.particles to input group J54.particles is not permitted.',
  name: 'OtherError' }
==== [projects] project query user  60bd74f968f0d140fd6d176c kttn false
==== [workspace] project query user  60bd74f968f0d140fd6d176c kttn false
==== [jobs] project query user  60bd74f968f0d140fd6d176c kttn false
==== [workspace] project query user  60bd74f968f0d140fd6d176c kttn false
==== [jobs] project query user  60bd74f968f0d140fd6d176c kttn false
==== [projects] project query user  60bd74f968f0d140fd6d176c kttn false
set_user_viewed_workspace
["60bd74f968f0d140fd6d176c","P14","W1"]
==== [workspace] project query user  60bd74f968f0d140fd6d176c kttn false
==== [jobs] project query user  60bd74f968f0d140fd6d176c kttn false
The problem seems to have been solved (at least for the moment), by rebooting the cryoSPARC master server machine. (I hadn’t tried this as I didn’t want to stop other jobs.)