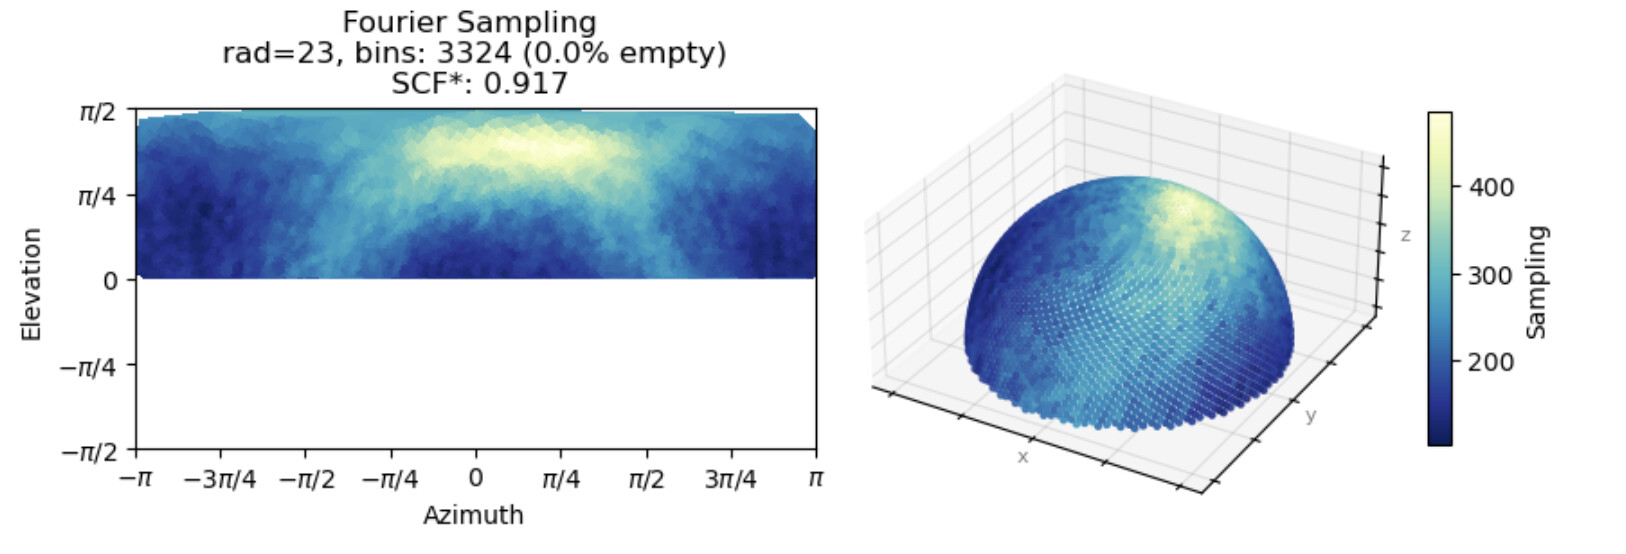
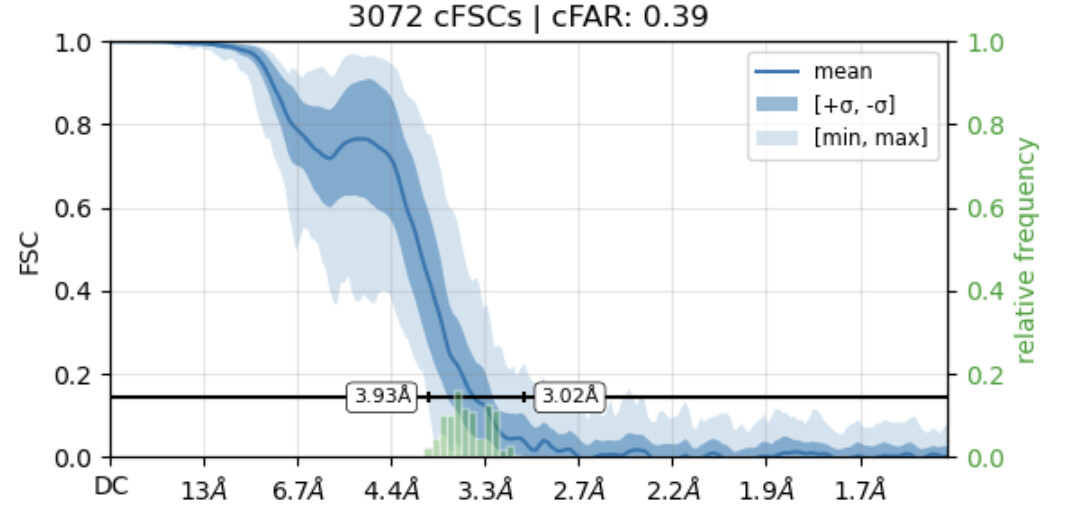
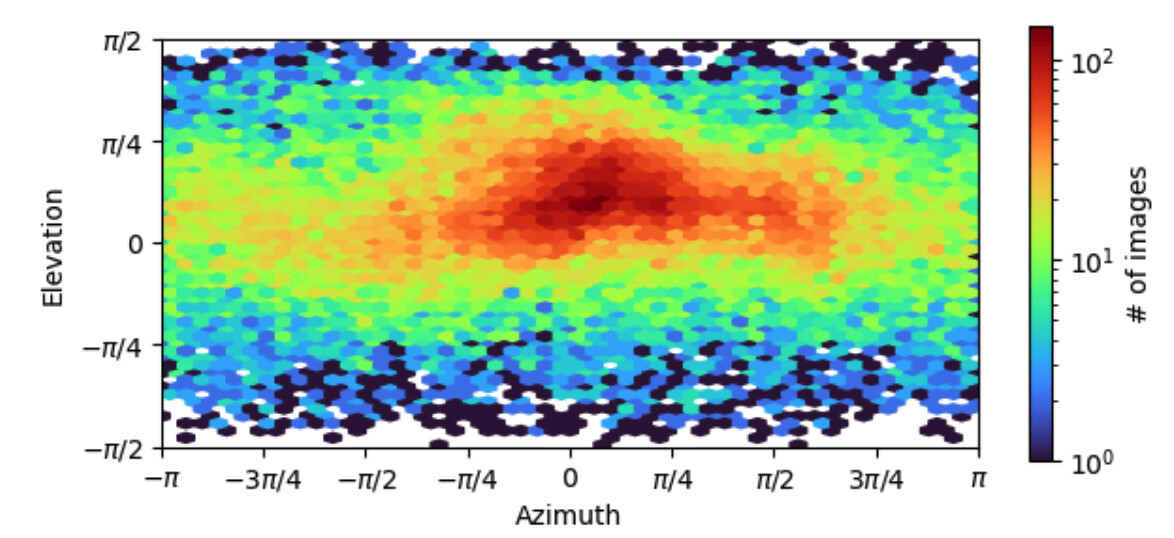
I have a conformation of a membrane protein with an obvious preferred bias. The map that I get out is interpretable and doesn’t seem to show any clear streaking. However, the cFAR I get is 0.39. That said, the SCF* is 0.917. Should I be worried about the cFAR? Is it likely that the anisotropy of the reconstruction could be affecting the biological interpretations? Including Fourier sampling plot, cFSC, and orientation plot for reference.
1 Like
If the map is interpretable and you don’t see clear anisotropy, I wouldn’t worry too much. However you might find that if you improve the cFAR, the map may become even more interpretable (e.g. peripheral regions better resolved), even if the initial map doesn’t look terribly streaky/stretched.
Thanks! I was leaning towards not worrying, but wanted to make sure I hadn’t just deluded myself
1 Like
I think it’s fine, just pay attention to what your map looks like vs what is expected for the resolution.
At that resolution (~3.4 Å nominal?) you should see a well defined backbone trace, and clearly defined large & medium sidechains with visually identifiable rotamers (in a perfectly isotropic map).
Does that more or less match up with what you see? xo
There’s a significant heterogeneity in the mobile regions of the map, so depends on where we are. But in the best parts that is true. In the worst parts I can see tubes with pitch (it’s largely helical), so that seems consistent with the cFSC range.
1 Like