Hello,
I’m trying to interpret the difference of Azimuth plots between datasets one and two. Could you please help me or point me to the right reference ?
thank you
Hello,
I’m trying to interpret the difference of Azimuth plots between datasets one and two. Could you please help me or point me to the right reference ?
thank you
When you open a map in Chimera (or after hitting “orient”), then you are looking down the map Z axis. The azimuth is a rotation around this axis, and the elevation is a rotation around the perpendicular Y-axis. Using star2bild.py to make a 3D plot for Chimera might help you interpret the 2D variety.
Based on your plots, I guess you have a cyclic symmetry applied, in which case the azimuth is straightforwardly going through the “side views.”
I was trying to come up with a teaching applet for this concept.
After reading through some documentation on Euler angle to azimuthal/elevation angle conversion I’d like some clarity.
Does a ‘top view’ have elevation angle 0, and side views have elevation angle +/- pi/2?
If we fix the third ZYZ Euler angle at zero, is the azimuthal angle the first rotational angle about the z-axis?
Is the elevation angle the rotation about a fixed Y-axis in the original reference frame, or about the rotated y-axis (after the first Euler angle rotation about the z-axis), i.e. is the elevation just the second Euler angle?
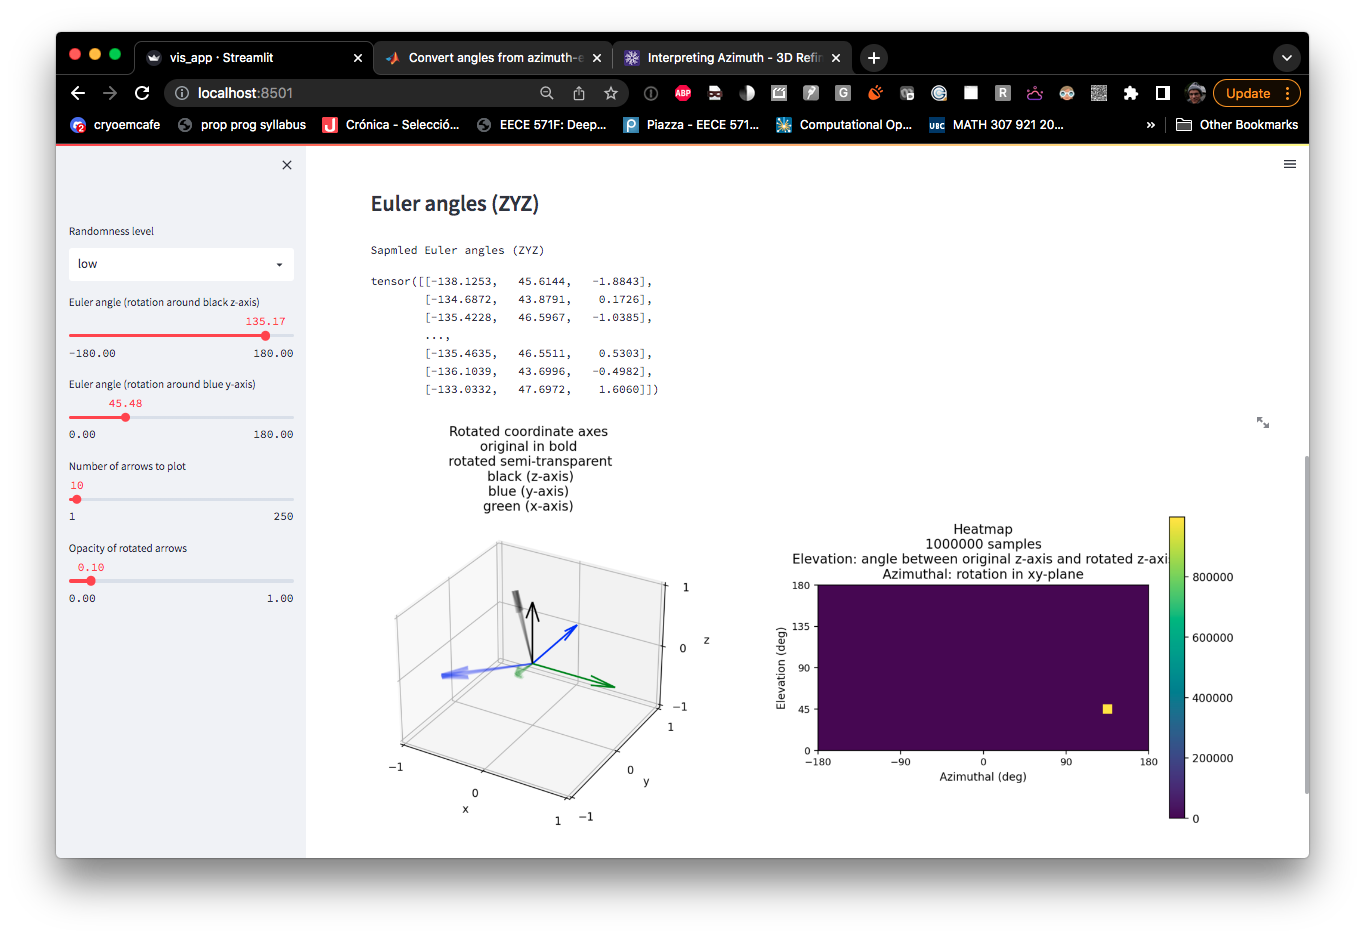
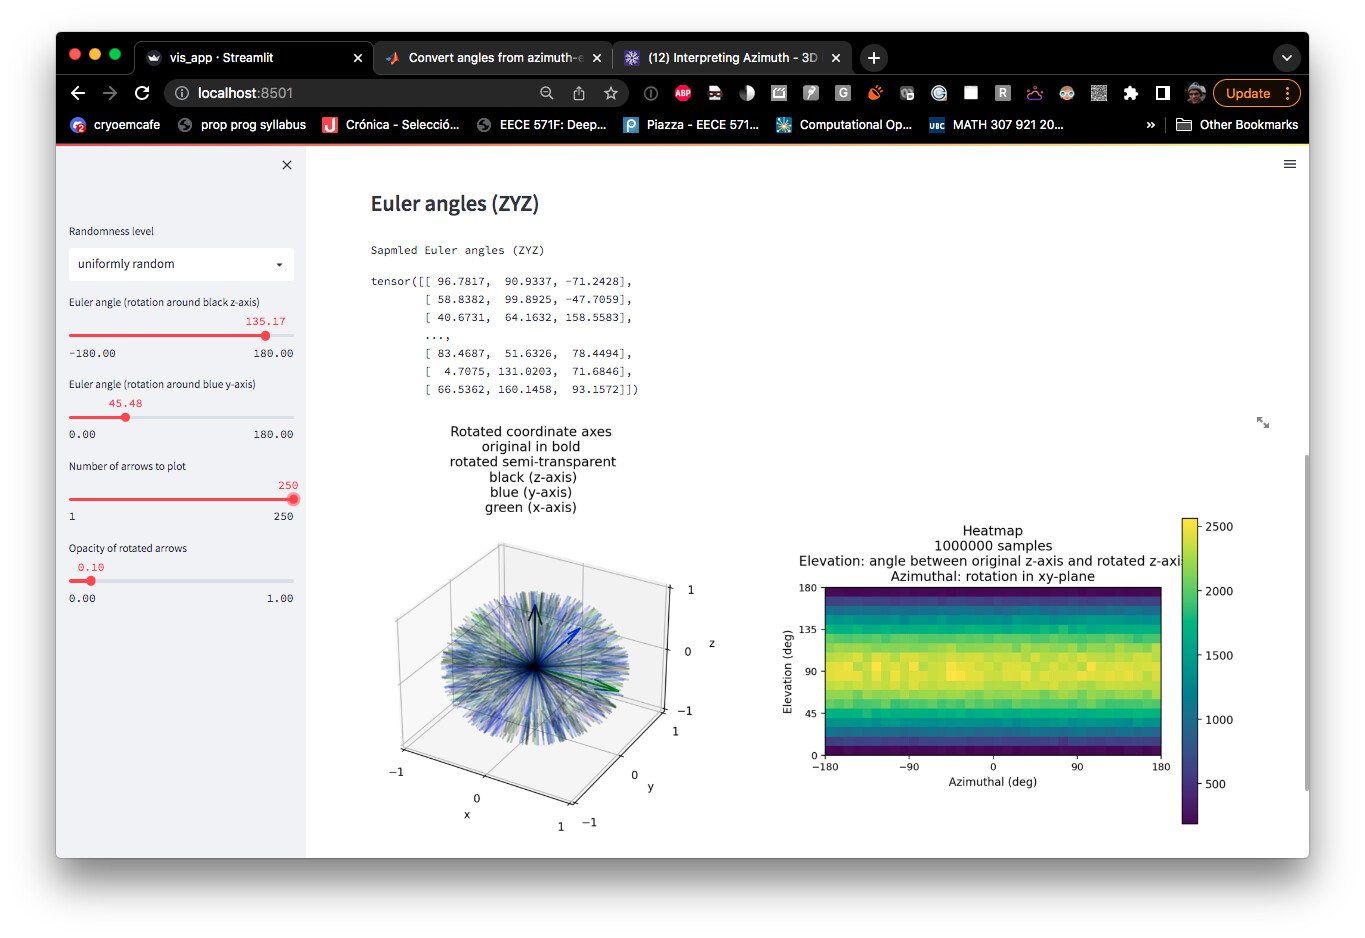
I’m making rotations according to the convention
rotation = pytorch3d.transforms.euler_angles_to_matrix(tensor([z_angle, y_angle, 0]).deg2rad().reshape(3), convention='ZYZ') and then randomizing them.
I’d like to match up the elevation axis with is used in cyrosparc
Hi @Geoffrey. Your teaching app looks great, I’d love to get to use something like that as well!
The Euler angle convention used most widely in 3DEM is the intrinsic ZY’Z’’ angles, with Z (no prime) defined as the Z-axis of the box. See here. This convention is shared by Relion/XMIPP and cisTEM/Frealign. On the other hand, cryoSPARC uses Rodrigues axis-angle vectors. You can see an example of a fully self-consistent cycle of conversion functions between these conventions, as well as rotation matrices and quaternions, in pyem.geom. You can also see how the Relion-style .bild orientation distributions are calculated in star2bild.py.
To your specific questions:
Does a top view have elevation angle 0
Yes
If we fix the 3rd angle (rlnAngleSkew or Psi) at 0, is the azimuth around the box z-axis?
This is true no matter the Psi angle, the primary angle (rlnAngleRot or Phi) is always about the box z-axis.
Is the elevation angle about a fixed Y-axis?
No, it is about the new Y-axis after the azimuthal rotation is applied.
Is the elevation the second Euler angle?
Yes, the elevation is (always) the second Euler angle (rlnAngleTilt or Theta).
===
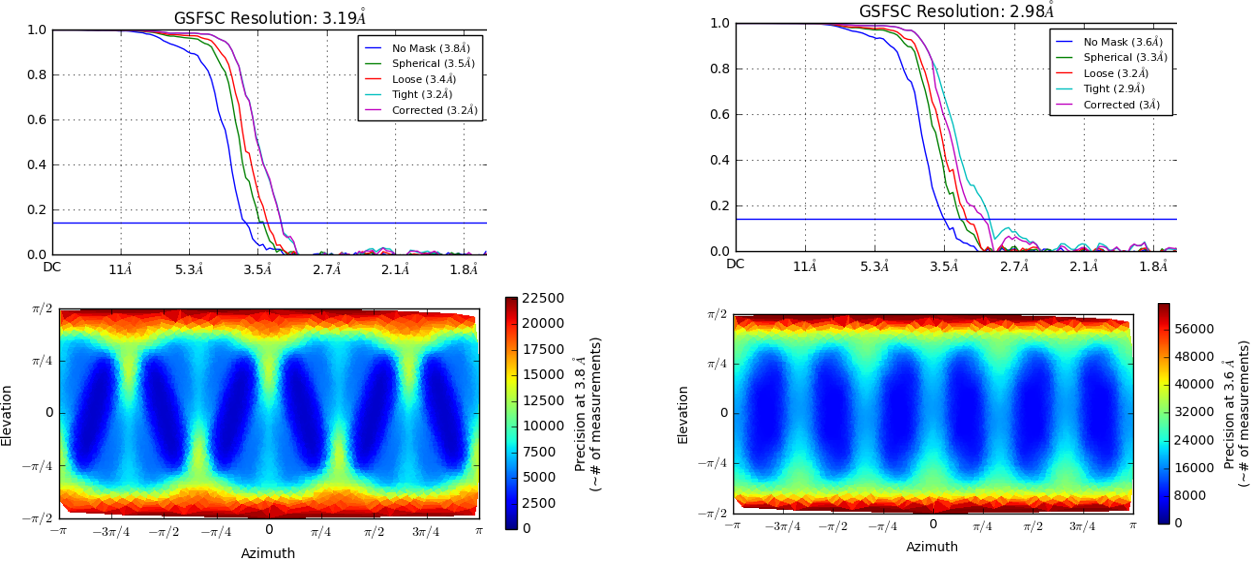
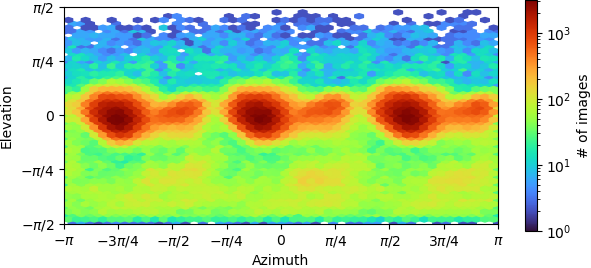
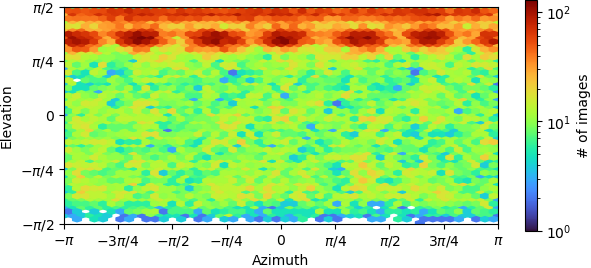
One additional point of confusion is that the distribution plots produced by cryoSPARC are shifted so that the side views are in the horizontal band across the middle of the plot with elevation 0. For example this one with C3 symmetry imposed, you can see peaks presumably for having each of the 3 identical monomers at the air-water interface.
This one has a preference for top views (apparent in the distorted map), you can see that the true top views are uniformly distributed around the azimuth as expected. For these views, Phi and Psi are degenerate.
===
As an aside, Relion and Frealign do differ in whether a transformation goes “from the map to the particle” or vice-versa. In Relion, rotations always go “from the map to the particle” so that rotating a map around the Z-axis of the box, then the new Y-axis, then the new new Z axis, will yield the same view as the corresponding particle. In Frealign, this is reversed, and the rotations rotate the particle in plane, then tilt ‘backwards’, then finally ‘undo’ the rotation around the box Z-axis. In most contexts, you can ignore the difference because Relion also transposes rotation matrices in memory before using them to make projections. Thus the two programs record numerically identical Euler angles in their metadata files despite this difference in convention.
Also - how are you computing your random angles? It’s not that straightforward, but there are some elegant methods. In many ways, the best one is to compute normally (Gaussian) distributed 4-vectors and normalize them to produce quaternions. The represented rotations are uniformly distributed.
Yes, that’s what I’m doing. I agree it’s quite elegant.
I’m also using some things in pytorch3d to convert back to the Euler angles.
Hi @Geoffrey,
I like what you are doing, is it possible to share the project on GitHub please?
Hi @DanielAsarnow, could you please let me know how to display the x, y and z axes of a map in the Chimera or ChimeraX software?
cofr showpivot true?
It could tell the coordinates, but the x, y and z axes didn’t show up.
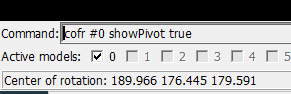
It’s for ChimeraX not legacy Chimera. It makes the cursor with the axes appear.
It does work, but is too small ![]()
showpivot 7,0.25
should make it bigger
Thank you@oli, it does work.