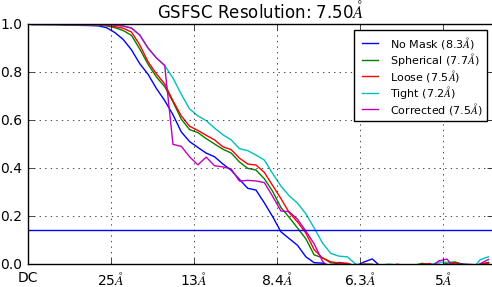
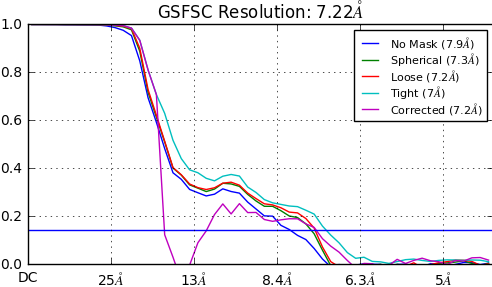
I am using cryosparc for reconstruction of a protein under a specific biochemical condition. I have only been able to obtain low resolution maps (7.5-9A) of my protein (under this condition) thus far despite quite a large dataset. Even after multiple rounds of heterogenous refinement starting from 2.7million particles (obtained from template picking) I am not able to push the resolution. While my thought was that there is conformational heterogeneity, I don’t really have strong evidence for it since the different 3D classes (from the heterogenous refinement steps) do not look to be substantially different, although this might be due to the resolution. I have been noticing that my FSC curves look very weird:
(1) The “tight” and “Corrected” FSC curves are noticeably different even close to the apparent FSC resolution limit
(2) The “corrected” FSC map, especially from earlier iterations of processing show a very strong dip at low resolution. However after rounds of heterogenous refinement to try and come up with a better set of particles this strong dip becomes much less apparent.
I don’t understand what causes the “tight” and “corrected” maps to be different and why the “dip” is so prominent in some refinement jobs and not in the others. Can these be used to somehow guide refinement strategies?
I’d be curious to see other people’s reply on this. Based on the fact that your FSC is decreasing really early, there is poor correlation between half maps early on. I wonder if your ab-initio model is correct? It might be worth starting from a new job. Are you using a model from another project?
To generate the Ab initio model, I took all particles and generated 4 ab initio models - the class with the most number of particles in it was used as the model.
Also, for several of the heterogenous refinement steps I use the same volume map as reference (as in say 4 replicates of the same map). Is there anything particularly wrong with this?
When you say starting a new job - do you mean refinement with a new Ab initio model?
@vincent: I tried a new Ab initio model and still the same thing.
I had one more thought. This dataset was collected at a new EM facility (K3/ super-resolution/0.55Apix/62e/40frames). After importing movies with the correct gain reference file, I noticed that there is a dark line running through the micrographs (horizontally). I tried flipping the gain reference file (X, Y and X+Y) but in each the micrographs were worse - I get light but noticeable vertical and/or horizontal lines. I spoke to the facility manager and he said his other users are aware of the issue and even with their datasets they notice the lines but they aren’t as prominent as mine (the other users use Relion and they need to flip X the gain reference file). The gain reference file was converted to the mrc format from the .dm4 file using EMAN2. Do you think this is a problem and could possibly contribute to problems with the FSC curves/low resolution-untrustworthy maps?
Hi @schow,
Thanks for posting. The detail about the gain reference and defect pixels is likely important. Could you post a screenshot of one of the micrographs from the streamlog of motion correction?
Can you also let us know the following:
What were CTF fits like? typically if gain reference or defect pixels are messing up the images, this will show as very poor CTF fits. If you can post a few CTF fit plots (from curate exposures or from the streamlog of patch-CTF) that would help to diagnose.
What is the orientation distribution like from ab-initio or hetero-refine? Typically if ab-initio is giving an incorrect structure, or hetero refine, this will manifest in that the orientation distributions will have typically just a single mode and not a good spread of particles. This is also a common resolution limitation that will not go away with more data/particles.