I know this subject is frequently discussed here. So I have tried several methods people recommend, but I couldn’t get a better result with the suggested solutions.
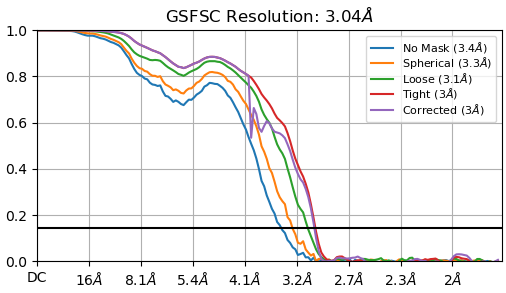
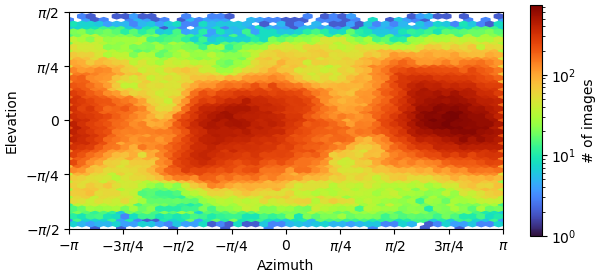
These are my GSFSC curve and 3D viewing direction distribution plot after NU-refinement with 374,955 ptcls. My sample is 65 kDa and a protein-RNA complex.
Box size was screened from 280 to 432 pixels, 1 pixel is about 0.9 angstrom.
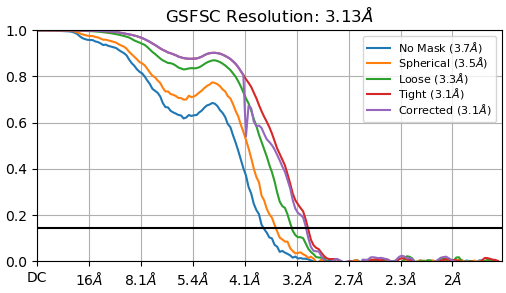
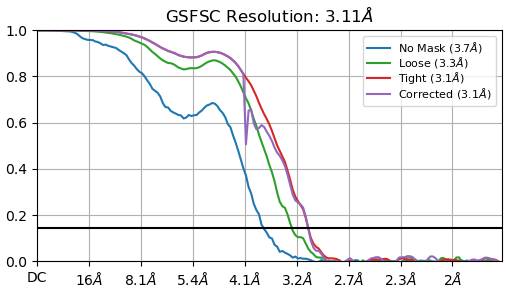
I ran Ab-initio with 3 classes using the particles. Each class was homo-refined and NU-refined.
I adjusted window parameters to 0.6/0.7
I changed the dynamic mask far/near values.
I made a mask manually(refer to mask generation tutorial) and provided the NU-refine job as a static mask.
I ran 3DVA with 3 components and used cluster mode to divide particles into 2 sets, which yielded 188,037 and 186,918 particle sets.
The trials above showed no improvement and the NU-refinement results of the 186,918 ptcls are attached.
I want to do local refinement to focus on the active site of my protein but I am concerned that the GSFSC get worse.
Does it look fine to deposit? Thank you in advance for any suggestions.
3Å is still a respectable resolution. If that’s all the data will go to… well, it happens! Have you also tried CTF refinement? If not, correcting for beam tilt, anisotropic magnification and optimising per-particle defocus will usually get a little further. But protein/RNA complexes can be troublesome…
For a 65kDa complex, I would suggest that focussed refinements will not improve things unless it is (pseudo-)symmetric and you use focussed refinement after symmetry expansion…
As for “does it look fine to deposit”… well, the FSC curve looks fine, but does secondary structure tally with what you would expect at 3Å - i.e., can you see clear alpha helices, larger side chains (tryptophan, phenylalanine and tyrosine for example) and beta sheet? Does the backbone trace well? What does the RNA density look like?
I have tried CTF refinement but there was no improvement in resolution and the dip of corrected FSC became bigger(it penetrated no mask curve).
I can see clear alpha helices, RNA bases, and large side chains in the map.
Though some phosphates of RNA are broken so several base pairs look like plates
(I guess this is because the side-view particles are still dominant), the overall shape fits well.
About local refinement, I will try because I wonder how the fulcrum setting would affect the local resolution. And then I’m going to prepare data deposition.
In addition to what rbs_sci suggested, I would try per-particle motion correction in cryosparc and compare with relion’s bayesian polishing. I have found best results with the latter.
Try per-particle defocus optimization by itself without per-group higher order ctf optimization. Beamtilt refinement can usually help a bit. Be sure to split your particles into beamtilt groups first.
Try 3D classification without alignments using a global mask to remove “bad” particles.
Try heterogeneous refinement to remove bad particles.
Try 3D classification with a mask on the poor region to isolate feature-enhancing particles, especially if it’s a region of interest.
Try NU refinement and turn off “window dataset in real space” and put dynamic mask threshold to -1
375K particles is a lot, even for C1. As others have pointed out reference based motion correction (RBMC) can get you 0.1-0.2A improvement. Were your raw movies .eer ? If so upsampling by 2 could do a little. How does the Orientation Diagnostics Job look from the NU ?
If you want to explore more…What happens if you put those particles and micrographs in a Manual Curate Exposures Job and cut the CTF for micrographs (5A vs 3.5A) ? Would picking with Topaz or training a better picking model help ? Sometimes this can.
If Model_Angelo can build in the unsharpened map that is usually a good sign.
As you mentioned, local refinement resulted in subtle changes and the resolution didn’t improve.
Maybe the complex is too small to get better by local alignment.
I think the only thing I have to do for now is to remove bad particles using 3D classification.
As I replied to cryofun, particles are already treated with the RBMC.
My raw movies are .eer so I am going to try to upsample my particles.
After 3D classification, Orientation Diagnostics with the best class(~100k particles) reported cFAR 0.33 and SCF 0.822, so my next plan is to play with 3D classification to remove bad particles.
You’re far enough away from Nyquist that upsampling probably won’t give any appreciable improvements. It’s not impossible (particularly if you redo RBMC with the upsampled particles) but I would look toward optimising exposure grouping. That is, if you collected with EPU “faster” mode, which uses beam shift acquisition, and haven’t already grouped exposures by tilt then you may see a jump after global CTF refinement as beam tilt correction is sensitive to tilt heterogeneity…
Unfortunately, I didn’t have enough time to do the whole processing from the first(meaning that I didn’t upsample particles) and 3D classification couldn’t completely remove bad particles according to the Orientation diagnostics result.
The quality of the original map and the DeepEMhancer sharpened map is enough to explain my biochemical assay data. So this ended up reporting the data with ~120k particles obtained from a 3D classification with a focused mask.
Starting with ~375k particles, I set the # of classes as 8 and the target resolution was 3 A.
I enabled Force hard classification and any other parameters were set default.
As a result, I got two particle sets with ~3.1 A and chose a better one to report.