Dear all,
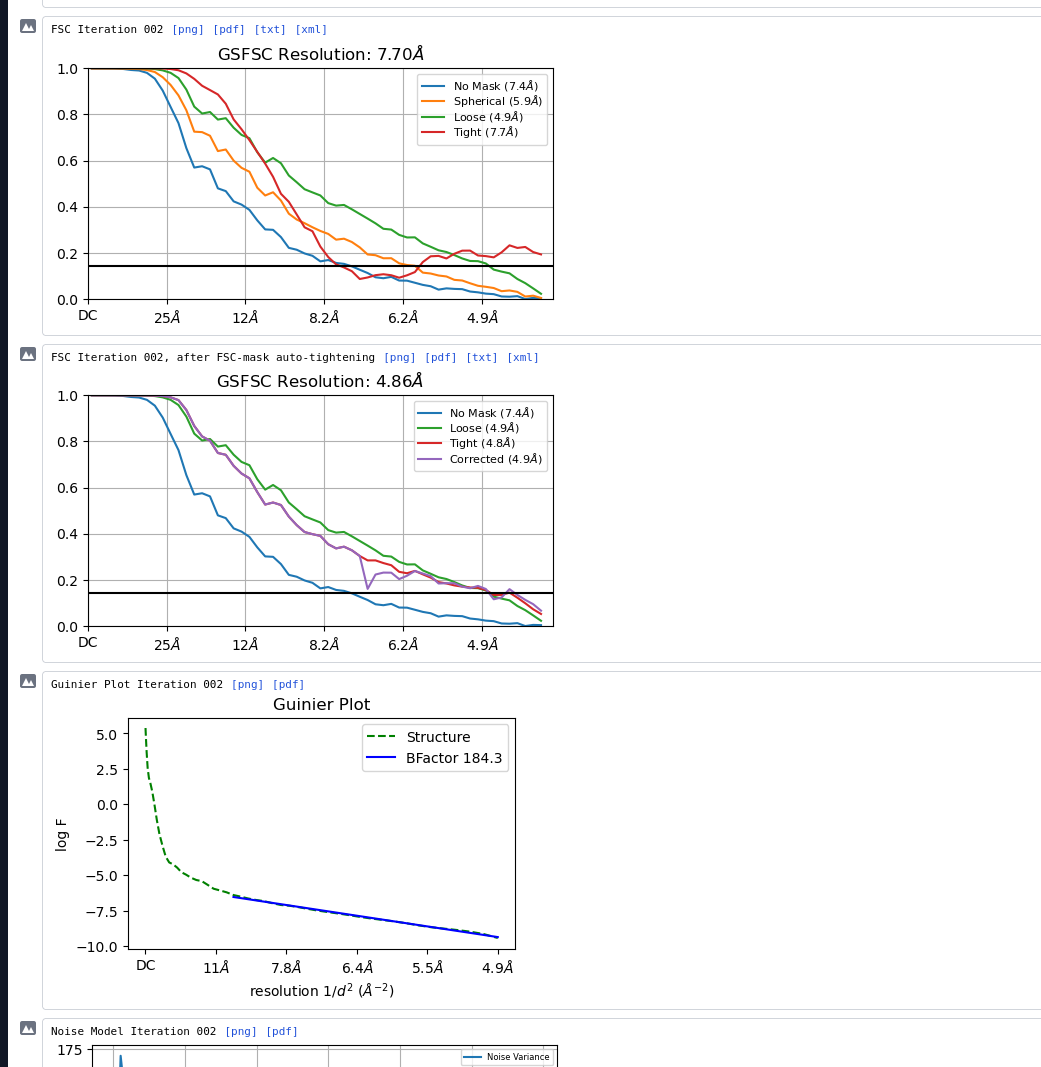
I’m a novice in image analysis and am trying to build a crude model from a set of our negative staining graphs. I have built several ab-initio models but none of them have a contour of the existing crystal structure. Also, a strange thing I noticed is that the final models all have a high resolution(~5Å) comparing to the usual resolution 10~20Å. I would like to know which step is most likely to go wrong. I used template picker method and did one round of homogeneous refinement. I could provide the result of each job if necessary.
I would start by creating templates from a low pass volume generated in chimera from the crystal. This will show you how it might look in 2D classes. Then compare with 2D classes. Further, can select similar 2D and run abinitio with those particles. Initial model generation is a difficult step.
1 Like
I’m not sure this is necessary - ab initio should work fine for negative stain data, no need to use crystal structures if data is good (and at NS resolution it will not tell you much in any case).
Regarding the high resolution - keep in mind that in negative stain, the “true” resolution is limited by the grain size of the stain (to ~20Å, depending on the stain), but the FSC only measures self-consistency of the two half-reconstructions. I would pay more attention to what the map looks like than to the FSC in this instance. Do you see a clear molecular envelope? How do the 2D classes look?
2 Likes
Thanks for your replying!
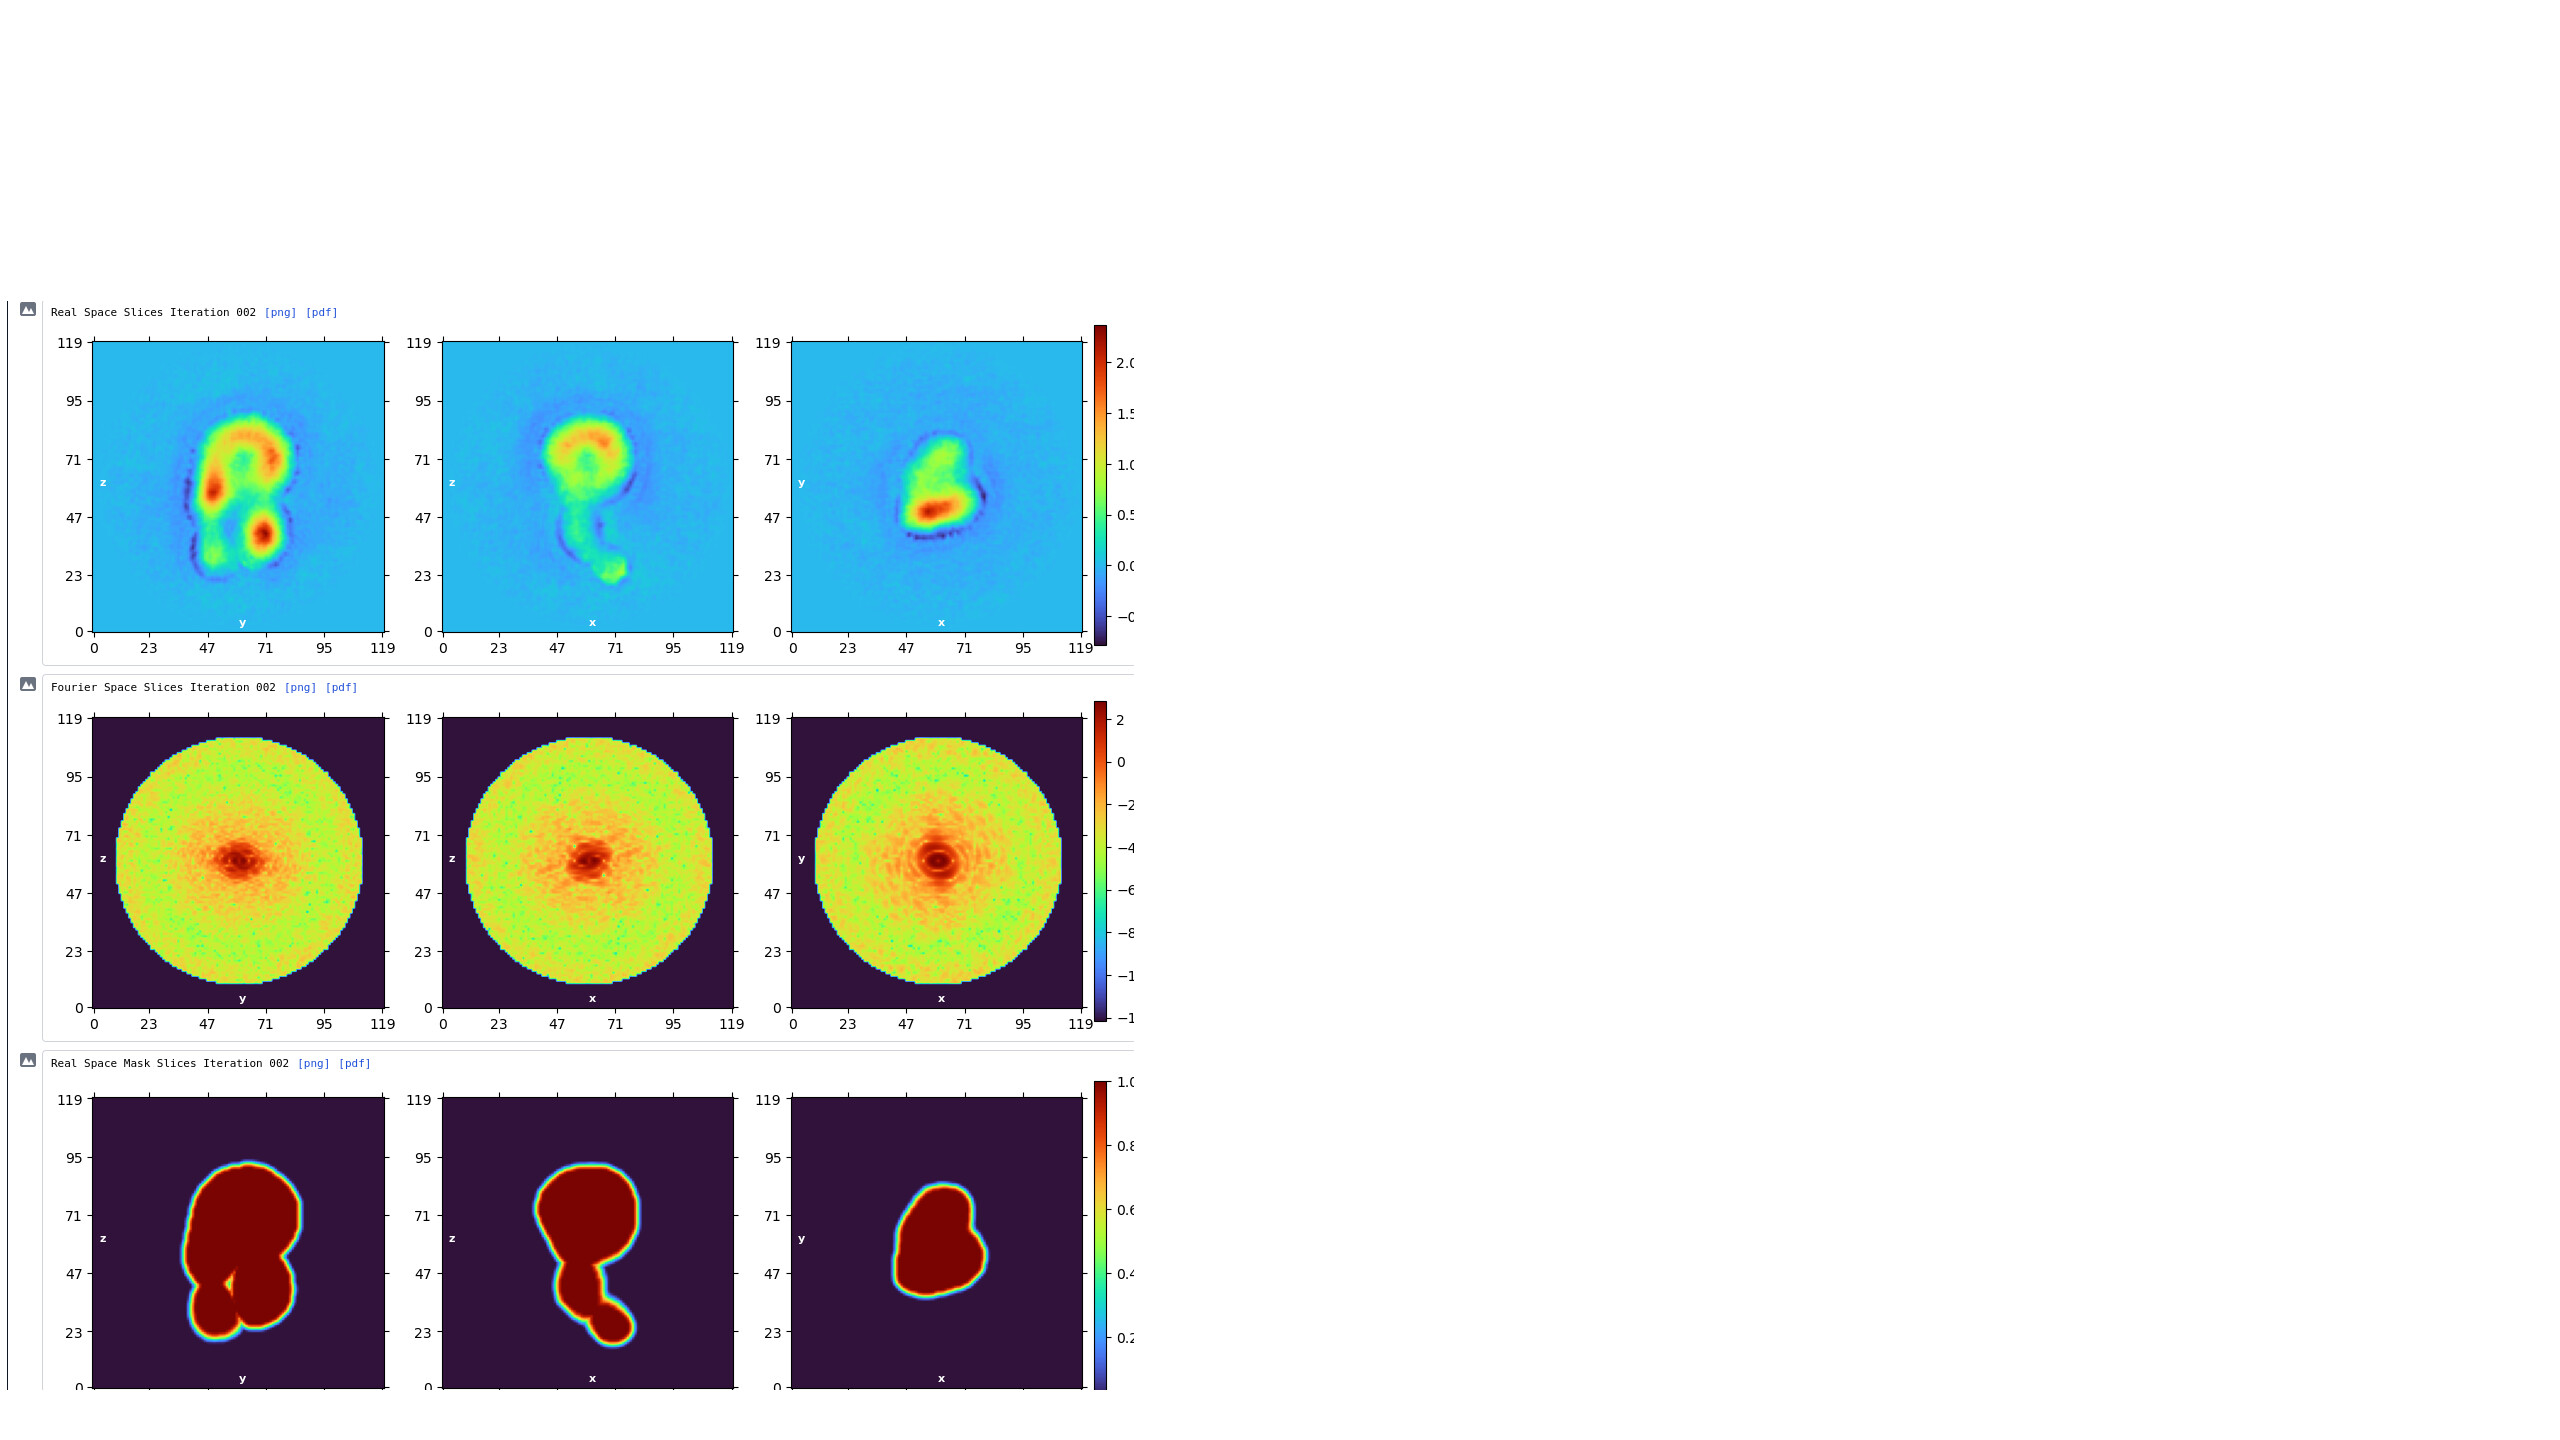
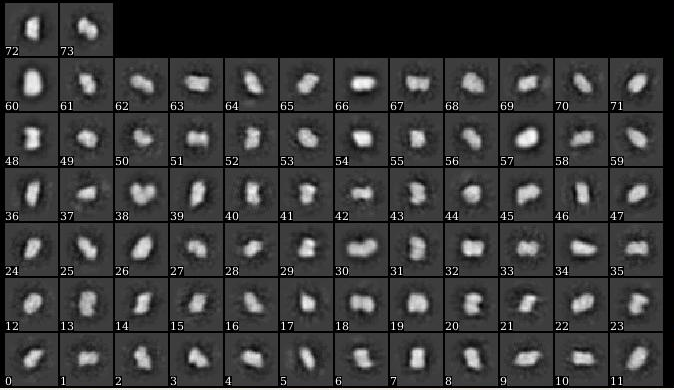
This is how the model looks like. I’m not sure if there is a clear molecular envelope.
There isn’t, really. I’d be hard pressed to say that there were any clear classes in the 2D, to be honest. At the least, class 1, 2 and 5 (from top left, moving right) should be removed. Or try ab initio with more classes as the projections from the 3D look nothing like any of the 2D classes.
Yes I discarded the 1,2,5,9,15 when I built the model. I show this graph because it has ESS at the bottom. But I do agree with you that the 2D is not clear. One problem I had is that when the number of 2D classes in its default setting(50), the computer will automatically crash. I tried to change the number and found that the computer only work normally when the number is limited to 15. I believe it’s a hardware problem and have contacted an IT technician. Right now I’m waiting for the result.
Also, I wonder if the bad 2D quality has to with the raw micrograph or my particle picking method.Here is one of the graph:
The sample is prepared by some else. He said that the EM technician told him the graph could be processed. But I do see heterogeneity in this and other graphs. Would this also be a problem?
Micrograph looks imperfect but normal. Good staining good defocus. There is definitely a lot of heterogeneity in the sample, and that complicates things. But I bet if you had 10x the data and 50 classes you would have many convincingly good classes to proceed with. Hopefully your picking with blob picker is basically perfect. Or use inspect picks to limit down to only the real particles.
Typically neg stain is useful for exactly the purpose here: inspection of the raw image to assess sample quality and particle homogeneity.
1 Like
Not sure how far you got with your data. My experience is that the standard settings for 2D classification are not perfect for stain data.
Try the following changes:
- Number of 2D classes: increase to 50/100 (depending how much data you have)
- Force max over poses/shifts: turn off
- Number of online-EM iterations: increase to 40/50
- Batchsize per class: 200-300
the contrast looks nice in your grid. try recording at sherzer defocus
with this heterogeneity, increase the data
1 Like
Thanks for the advice! I got some feedback from the data collectors and they said the next thing I could do is manually picking 4~5000 particles, lowering the resolution to ~6Å, doing the 2D classification and then using ISAC to check the heterogeneity of the particles. Right now I’m at the last step but I could go back and redo the 2d class.
with this contrast there is no need to pick anything manually. use the blob picker, then inspect particles and do 2D classification with 100 classes. then pick the most promising classes and redo picking with template picker. could you share 2-3 more micrographs?
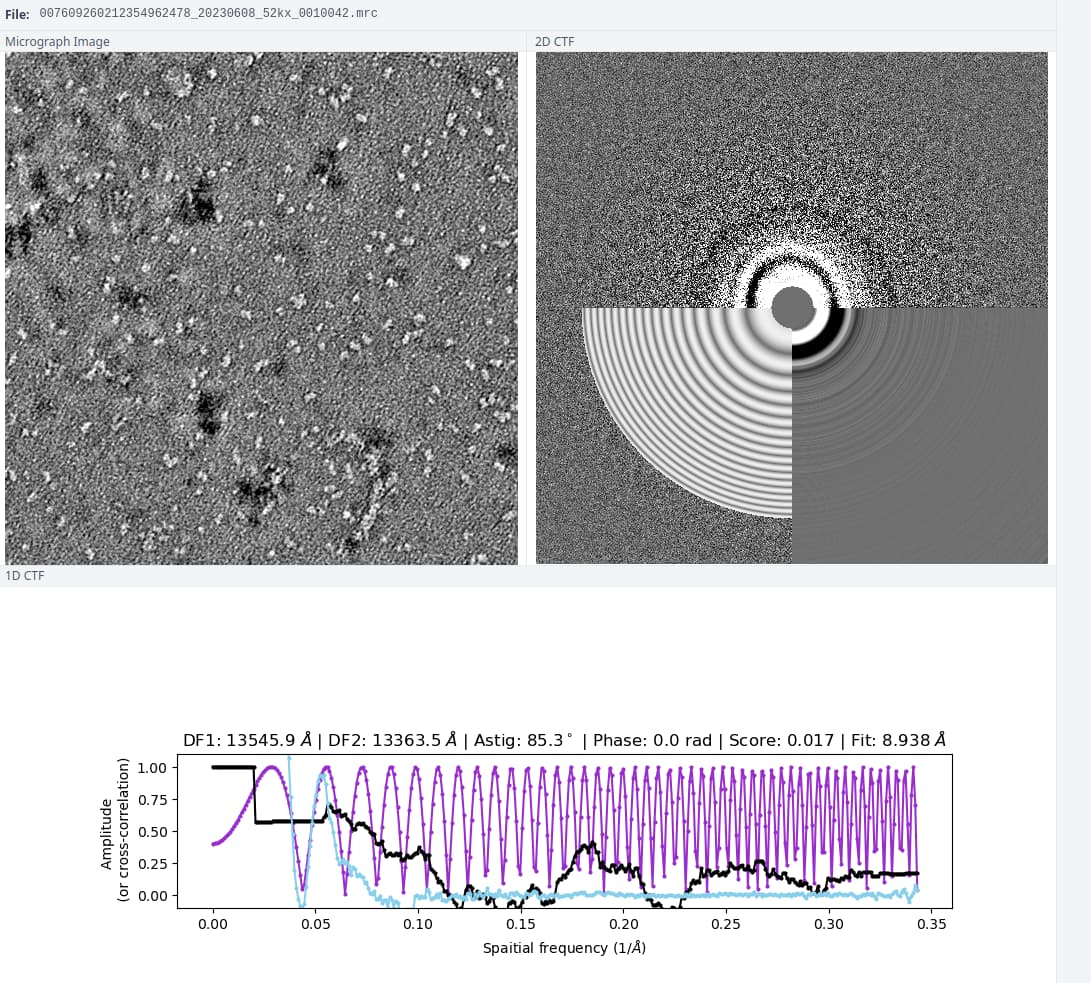
P.S. i guess you have CTF correction turned off anyway (or selected “constant ctf” in the import job). But the fitted ctf doesnt really match the actual thon rings.
Yes here are the micrographs:
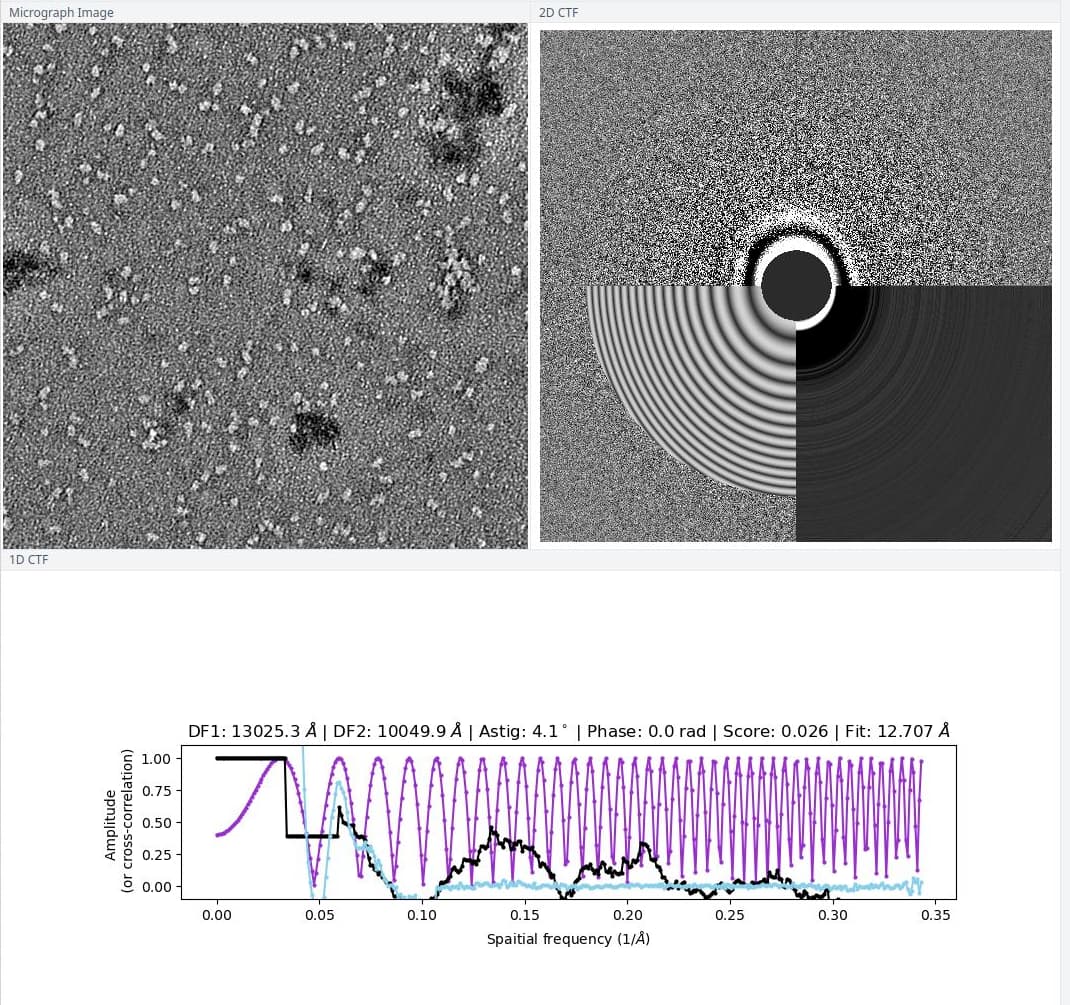
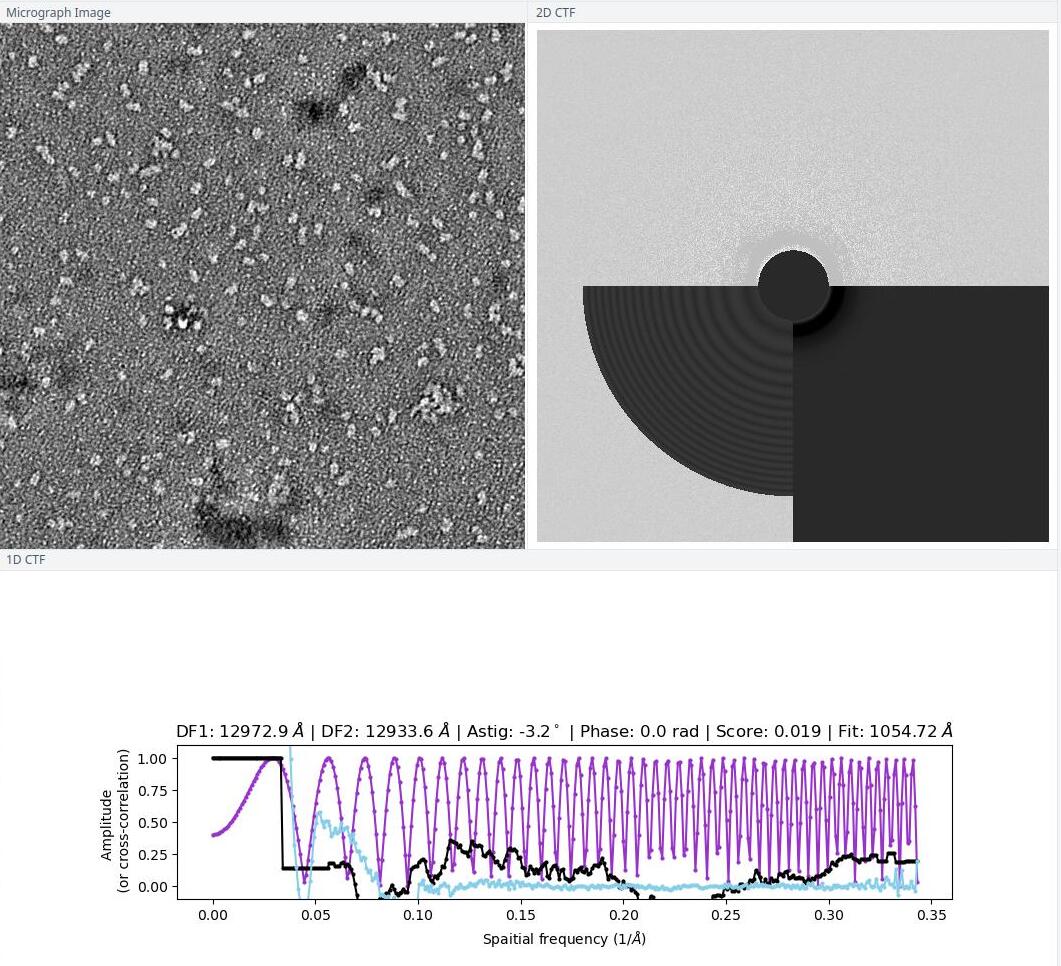
(I don’t quite understand why in some 2D CTFs the bottom part are darker, but they said I could use those graphs.)
Also I get the 2D classification result from the manually picked particle result and could share it with you. I will also try blob picker.
You should decrease the search resolution a bit (decrease “Minimum search defocus (A)” to 500, as the most information are the lower frequencies. This will also improve the CTF estimation itself.
The black part is due to the contrast of the CTF, where the most intense areas (lowere frequencies) are covered by the grey circle (adjustable with the “Minimum search defocus (A)”)
Not sure if it will help much, but definitely increase the box size. Try that combined with the other parameters I suggested above
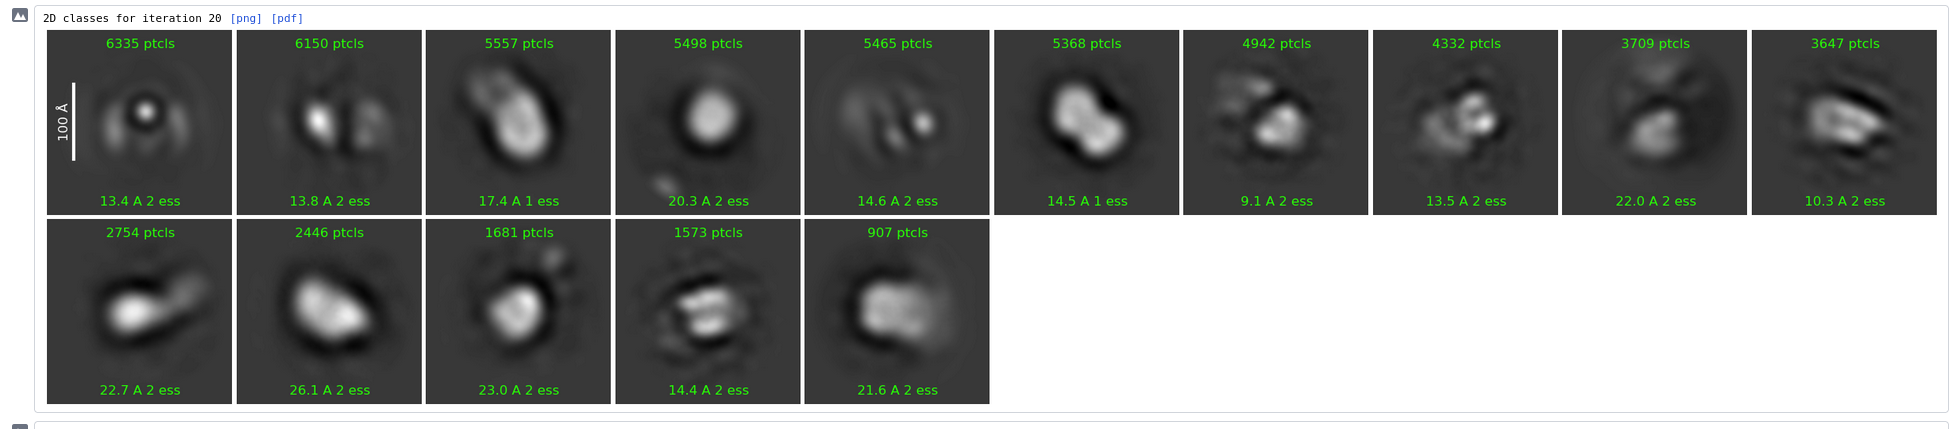
@DarioSB Hi, I’m following your suggestions to process the data again. The blob picker generated ~37000 particles, I selected 14 classes from 100 classes as a template(I don’t know if the size is too small for a template, but other classes really don’t look like particles.) Then the template picker generated ~70000 particles. I did several round of the 2D classification and got this result(~7000 particles):
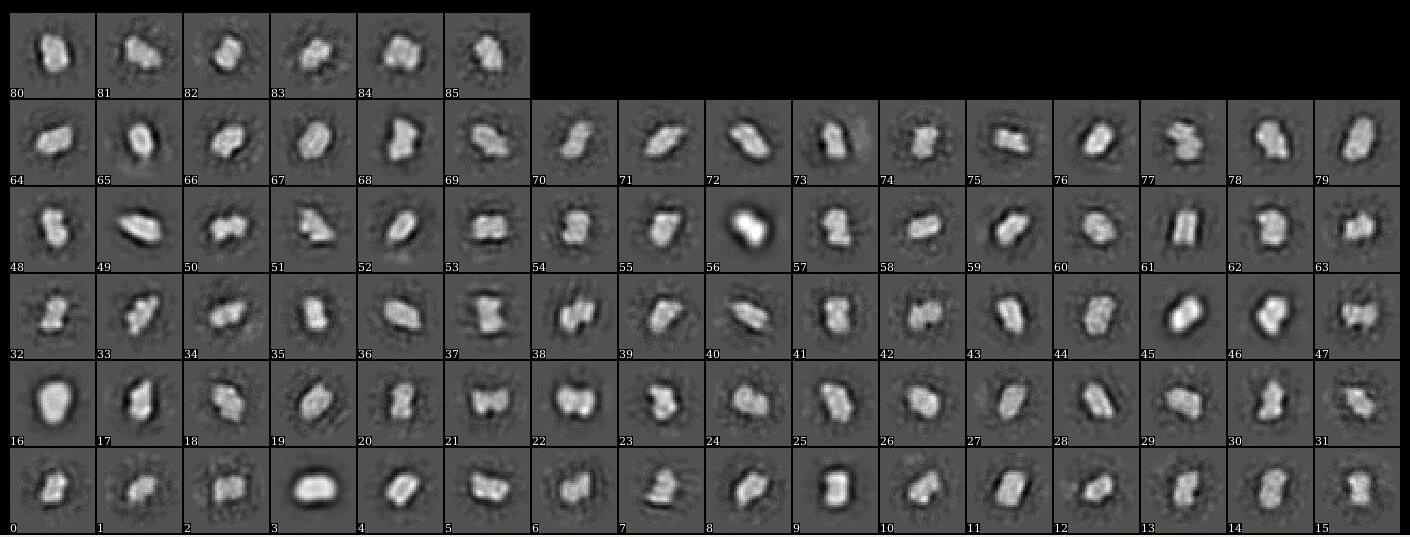
They look better to me then the first 2D classes you showed. Why is the resolution of the images so low? Did you do exposure curation? Some classes look like there is quite an astigmatism.
Do you still have sample? It might be worth to make a few more grids to get one with better stain quality. What stain / stain method do you use?
1 Like
I don’t know if it is the reason, but someone told to use Fourier crop size to reduce decrease the resolution to ~6A/pixel(the original is 2.06A/pixel).
I did the exposure curation, I kept the micrographs that have the 2D CTF graph like I posted above.
I did not prepare this sample, but I think they use uranyl acetate.
Yes, I think the next step could be contacting them to do more scanning. However, I would also like to know what else I can do with this dataset. For example, will there be a big difference by using another software(like EMAN2) to analyze it?
I am not aware of that method, try without. It might be to speed up the processing, but you wont have as much data as you need for cryo anyways.
You can definitely do that. I once analysed the exact same (cryo) data set in cryosparc and relion and got much better results in relion (in terms of finding good 2D classes). On the other hand, same protein, different cryo data set, cryosparc was superior over Relion.
So its worth a shot, though I doubt with stain there will be a big difference.
Which structure is it btw?