Hi all,
I’m having trouble with the reported GSFSC resolution of my structure. Although my resolution is reported as 2.37 A, when I open the structure in ChimeraX, it seems not much different from my previous 3+ A structures. Furthermore, when comparing my 2.37 A structure to a 2.68 A structure from EMDB and a molmap structure at 2.4 A, the 2.68 A and 2.4 A structures contain much more detail. Would anyone be able to tell me the reason for this? Any help is much appreciated!
I’m also happy to share images and information about my workflow if that would help answer the question. So far, Homogeneous Refinement resulted in a 2.37 A structure, while NU Refinement resulted in a 2.39 A structure. Both refinements used ~1 million particles. Sharpening hasn’t seemed to help.
Thank you,
Nick
Hi Nick,
What do your FSC curves look like? Did you double check that the mask used for FSC calculation was reasonable?
Cheers
Oli
1 Like
Hello Oli (@olibclarke),
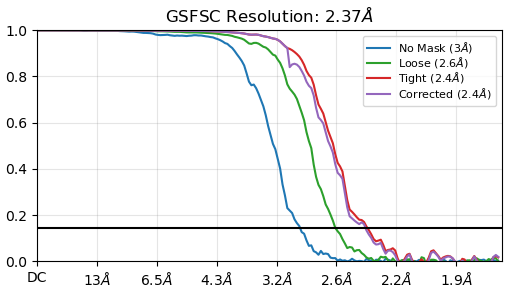
Thank you for your quick response. Attached is my FSC curve after auto-tightening (I can only upload one media file as I’m a new user). I did not double-check the mask, and truthfully I would not know what to look for. Could you give me some tips in this regard?
Best,
Nick
FSC looks fine - no obvious indications of overfitting or duplicate particles. Having said that I would always suggest double checking the mask used for FSC calculation as described here: https://guide.cryosparc.com/processing-data/tutorials-and-case-studies/case-study-end-to-end-processing-of-an-inactive-gpcr-empiar-10668#id-20.-checking-and-updating-the-masks-used-for-fsc-resolution-reporting
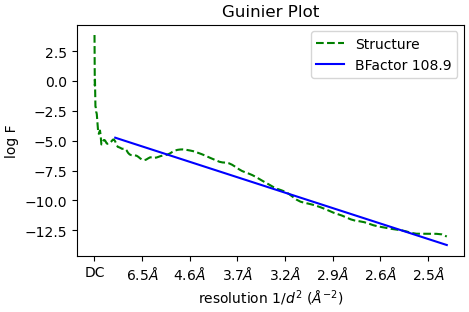
You mention that sharpening hasn’t seemed to help - what B-factor is estimated by CS and can you post the fit?
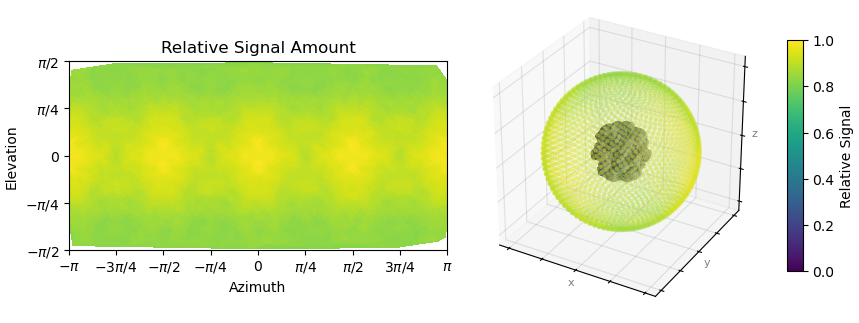
Also, is the density anisotropic? Can you post the results of orientation diagnostics?
Cheers
Oli
1 Like
Thank you for the link: I’ll look into it and double-check my mask.
The estimated B-factor is 108.9, and my Guinier plot is attached here.
The density is likely anisotropic, as I see some preferred orientation. The protein I’m looking at is D4 symmetric, and I see much more of the side view in the 2D classes than the top view. One result from orientation diagnostics is provided in my next post: which other plots should I provide?
Best,
Nick
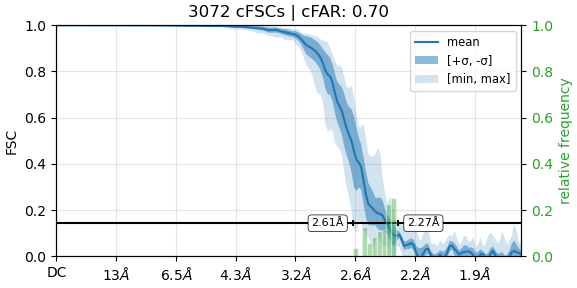
Both of these look pretty normal… how does the summary of cFSCs look (the FSC curve plot in orientation diagnostics)?
1 Like
Here’s what we’re looking at:
I’m still not well-versed in the meanings of all the different plots, unfortunately, so I really appreciate your help!
Ok so there is some anisotropy here but pretty minimal. Wouldn’t expect this to affect density quality significantly… based on the FSCs & anisotropy results, and assuming appropriate sharpening/postprocessing, in the best regions of the map you should be able to clearly identify even small branched sidechains like threonine/valine, identify carbonyl orientations, and see a few waters. Does this correspond with what you see? Perhaps you could post some images of the density?
1 Like
@snydern2000 FYI molmap does NOT simulate a map at the specified resolution (read the description). A given numeric value for molmap will produce a map with much higher resolution features than a real map of that nominal resolution. You should really only be using molmap to help generate masks. Also, sharpening does not affect the resolution of a map, which seems to be a misconception above.
I’m afraid you’ll have to post the actual density at a couple contour levels for this one. The only oddities so far are the b-factor is slightly high given the resolution, on the FSC curve is a bit jagged considering there were a million particles.
Something about these particles or your reference is apparently leading to aggressive over refinement, if the real resolution is not similar to ~2.4Å. Perhaps there is template/reference bias due to high initial resolutions? Or perhaps the mask is excluding some large areas, though that should cause a bigger drop to the “corrected” FSC curve.
4 Likes
@olibclarke @DanielAsarnow Well, I think the solution may be simpler than I had assumed – I had not adjusted the contour level in ChimeraX (can you tell I’m new at this?  ). But maybe you can answer a question for me: how do I best choose a contour level? Is it mainly subjective, and does CS provide an initial starting point? I apologize for using your time on what seems to be a simple solution, but I really appreciate your help!
Subjective. Pick one that reveals the features you want to inspect, and adjust as needed. Glad you figured out the issue!
2 Likes
As @olibclarke says, it’s subjective, but 3, 5 and 7 sigma are good starting points (volume #[number] sdlevel n)
3 Likes
With regards to comparing different maps, sigma levels are more comparable between maps (and at a more “normal” scale) with unmasked maps, and if data outside the diameter used in the reconstruction is ignored. Still not quite suitable for difference maps, and the values don’t line up with x-ray rules of thumb (e.g. 3.5 for water or what have you), but can be useful.
map.py -n -d <diameter> map.mrc zscores.mrc
or use -r refmap.mrc to use another map to normalize to another map.
Another approach for comparing maps instead of same RMS value / Z-score is to set different thresholds that give (roughly) the same enclosed volume. I believe this is how Chimera normalizes volume series for animations when that option is on.
3 Likes