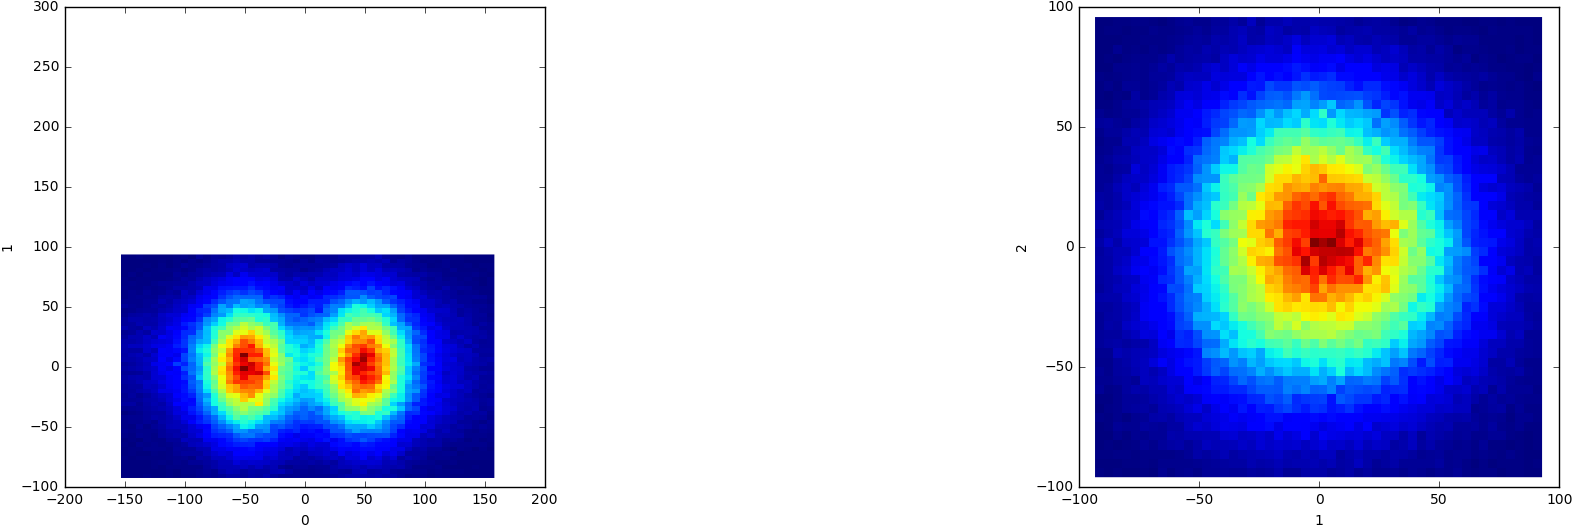
After running the 3D variability, it gave me the following results
and I was wondering, how do I approach this? Does that mean there are two distinct conformations of my molecule? If so, how do I separate them, since opening the series isn’t particularly helpful in actually discriminating these two “clusters”.
Appreciate the help.
Clustering mode w/ 2 clusters will probably work well in this case, at least in separating the clusters from that plot.
In what way is the series not helpful? Component 0, frame 6 say should be mostly in the left group, while frame ~14 will be mostly in the right group. When you watch the movie across the frames in the volume series tool, do you see reasonable motions? Or perhaps a more general “quality” axis? When I have seen something similar, I was indeed able to get 2 discrete conformations eventually, though based on classification guided by the variability rather than directly from 3D var display.
Edit
I guess you mean, it’s not helpful in actually separating particles rather than understanding the dynamics. You can also use the extremal 3D Var volumes as classification references.
1 Like
Oh, so if I choose to do a clustering (via the 3D Var Display) and select Cluster mode with 2 clusters, will that separate the two?
What do you mean exactly by:
based on classification guided by the variability rather than directly from 3D var display
And yes, the major differences between the frames are related to the “noise” and dynamics surrounding the particle, that’s why I am not able to distinguish and separate the classes.
You should use a mask that eliminates any micelle or disordered regions with uninteresting dynamics - that’s quite important for e.g. membrane proteins. The clustering mode basically clusters the scatter plot with k-means. Choosing 2 will probably work nicely in this case, you can try 2 - 4 and check skip reconstructions to make it faster.
My comment means that I looked at the volume series trajectory to understand what each principal component represented, keeping in mind that true particles are linear combinations of each component. Then I assessed how these degrees of freedom relate to my expected biological context and function and used them to inform my further classifications, focused mask design, mask size, etc. in all processing in every software.
1 Like
Hi @stavros, thanks for your question, and thanks @DanielAsarnow for the detailed responses!
I also would suspect that using the “cluster” mode in 3D Var Display will help here because it will separate the two clusters you see and create separate reconstructions (and particle sets) from each cluster which you can then refine separately. Masking of disorder that you are not interested (as Daniel mentioned) is also very important. It’s also important to select a reasonable “filter resolution” in 3D var and 3D var display so that the variability components more clearly display underlying variability in the molecule.
2 Likes
By the way, there is a relatively detailed tutorial for 3D var and 3D var display here, including the cluster mode:
Hello @apunjani and thanks for the reply.
I indeed followed the tutorial, but I was not sure how to deal with cases like mine where two (or more) distinct clusters appear. For example: In the tutorial it mentions how to visualize the different clusters, but not how to efficiently separate them once found. Another example of data intepretation was how obvious it was to @DanielAsarnow what component 0-Frame 6 would contain, but I am still uncertain how to best determine the experimental settings such as selecting how many components and cluster intermediates the 3D var job should be run with.
Also you mentioned selecting a “reasonable filter resolution”, how would one reasonably estimate this? The structure in question for example is “solved” at 3.4A (but in reality it is overfitting of “high-resolution” regions of micelles and disordered noisy regions). Would it benefit from a high-pass filter?
If these questions are answered elsewhere and I missed it I would appreciate a nudge to that direction.
Thanks again!
Stavros
Hi @stavros, you are right the tutorial is unclear - the clustering section mentions in the text that the 3D var display job creates subsets of particles and individual reconstructions for each cluster, but the step-by-step instructions don’t mention this. We’ll fix that.
3DVA is still in development unfortunately to some degree experimentation is right now necessary to determine the optimal settings and interpretation for a given structure. Right now, the filter resolution is set manually, eventually we will auto-determine the best filter from the incoming refinement information. The filter used in the 3DVA is a “butterworth” filter, meaning that it does not harshly cut off spatial information beyond the nominal resolution, but softly decays it. So a filter resolution in 3DVA of 5A actually allows 5A information to be retained from iteration to iteration, but also allows ~20% of 4A information and 5% of 3A information as well. So the filter resolution should be set to a somewhat lower resolution than the refinement FSC resolution. E.g. for a 3.5A structure I would usually first start by setting it at 6A and see what kind of variability/flexibility is present. If there are very large motions, I would run 3DVA again with e.g. 10A filter to better capture those large motions. If there are small motions then I would run it again at 5A or 4A.
Note that the 3D Var Display job can also apply a low-pass filter resolution the same way when creating output volume series, but the actual results of 3DVA can be different based on the filtering applied.
3 Likes
Sorry, I meant to send this the other day, but apparently left it as a draft.
I have been using a high-pass at 30 A and a low-pass at 4 - 6A depending on if I want to see individual loops moving or just larger domain motions. I don’t think signal lower than 30 A is important for our interests - maybe it could be moved to 40-60 A for a very large particle. (Note that diffraction data are usually physically high-pass filtered around this resolution by a beam stop).
2 Likes
I want to amend my previous post. I have since found that a high-pass filter prevents capturing motions connected to the presence of a complex subunit (for obvious reasons). I currently use no filters, or a conservative low-pass.
1 Like
@apunjani hello, and sorry to continue this thread but I thought my question is somehow related to understanding the results of 3D variability analysis. I remember reading somewhere (I can’t find it anymore !) that the order in which the components are outputted is related to the “importance” of the motions observed within the components, i.e. the first components contains the largest motions. Is that correct, and if yes/not could you refer me to any place in the forum or anywhere else where this was mentioned, if possible. Many thanks !!
@marino-j it’s true that the order of the components is determined by the variance of each component. However, with no estimate of the total variance, there is no way to determine what proportion of the data is explained by each component. In practice, the components seem to have very similar variance, and do not exhibit the sort of exponential decay expected in traditional, algebraic PCA.
@apunjani told me that they are working on a 2D error based measure so we can see how much is gained from each component. Something like this is badly needed IMO, right now I am justifying the consideration of specific components to reviewers just based on what I see in them. The phenomenological analysis of the components will be stronger if one could say, “the first component, explaining 70% of the variance, has the protein do X.”
3 Likes
@DanielAsarnow thank you for providing an explanation. And I totally agree with you that a way to quantify the contributions to the various components is necessary, especially when comparing variability analysis for similar proteins. Cheers
Hi @DanielAsarnow @marino-j,
this is definitely an important and interesting topic. We have been trying to come up with an error measure or some kind of variance measure to denote the relative “importance” of different modes. As @DanielAsarnow mentioned, typically we don’t see that the variance of modes decays rapidly. And this is actually due to the noise present in the images - the variance of particle locations in the 3DVA latent space (i.e. what you see in the scatter plots) is a sum of both the true density variance of the particle and the variance of the image noise in the 3DVA subspace. With typical noisy cryo-EM images, the second variance is on the same order as the true density variance of the structure, and so even if components have decreasing importance, the variance of particles in the latent space doesn’t decay very fast.
This is related to why it is difficult to say that “component 0 accounts for 70% of the variance in the dataset”. Because we can’t actually measure or know the total true variance of the particle density - we only observe it in addition to image noise. So we can compute the percentage - but it will be like “component 0 accounts for 0.1% of the variance in the dataset” since 99% of the variance in the dataset is just image noise (i.e. electron shot noise). Separating these two in a sensible way needs a different approach than how we would ordinarily think of PCA. It’s also good to keep in mind that 3DVA is directly equivalent to typical PCA, if you could do PCA with missing data, CTF corruption, per particle scale, and huge numbers of variables.
4 Likes
I’m hoping I might be able to continue the conversation here. I have a protein with significant movement of large domains but additional movement of smaller chains/stands. I’ve been using a filter resolution of 14 A which seems to be decent for the large movement but I would like to capture the smaller movements. How would changing the filter order affect this variability analysis? It sounds like there would be more or less information from higher-resolution depending on how the filter order falloff works. I would love to find the sweet spot between including higher resolution information and excluding noise.
Hey, have a look also at the “new” 3D classification method as described here Tutorial: 3D Classification | CryoSPARC Guide
In many cases (even for fairly large movements) we have had better results using a filter resolution approximately comparable to the global resolution of refinement (rather than basing it on the estimated magnitude of movements).
I’ve tried all sorts of filter resolutions in this case, although the last time I tried something more refined I did have a few more noisy particles in the dataset. My overall resolution is around 3.6 A, although I don’t necessarily trust that the number given in the global resolution is representative of a lot of the local resolution. I have a pretty stable portion that might be skewing the global average. If I try clustering and further refinement I often get worse resolution as more of the flexible end becomes visible in the map. However, I did start another attempt last night at 10 A instead of 14 A to see if it helps any.
1 Like
I have tried that at some point, although I might as well attempt it again since I’ve filtered out some noisy particles since my last attempt.
I’ve been really excited for the 3D Flexible Refinement to come out, and really I should reach out to the cryoSPARC team. At this point, I’m not sure it’s possible to resolve the whole molecule to any appreciable resolution using the current available methods.
1 Like
I remembered another reason why I’ve shied away from setting the filter to a higher-resolution in 3DVA- my particles are fairly large and there are over 800,000 of them, and there’s just not enough memory to process at this box and pixel size. I’ve tried downsampling in the past, but in the final stages of angle/bond and Ramachandran restraints my statistics ended up a bit off because of A/pix rounding, which in the end results in a larger physiological inaccuracy due to the large volume of the molecule exacerbating the rounding effects.
I suppose I should be able to find a reduced box size in which the map wouldn’t be affected by A/pix rounding. I definitely have room to downsample without affecting resolution. Or I could possibly downsample just for 3DVA and if I find a subset of particles which give a good overall resolution I could re-extract at full size for the submitted model.