Hi,
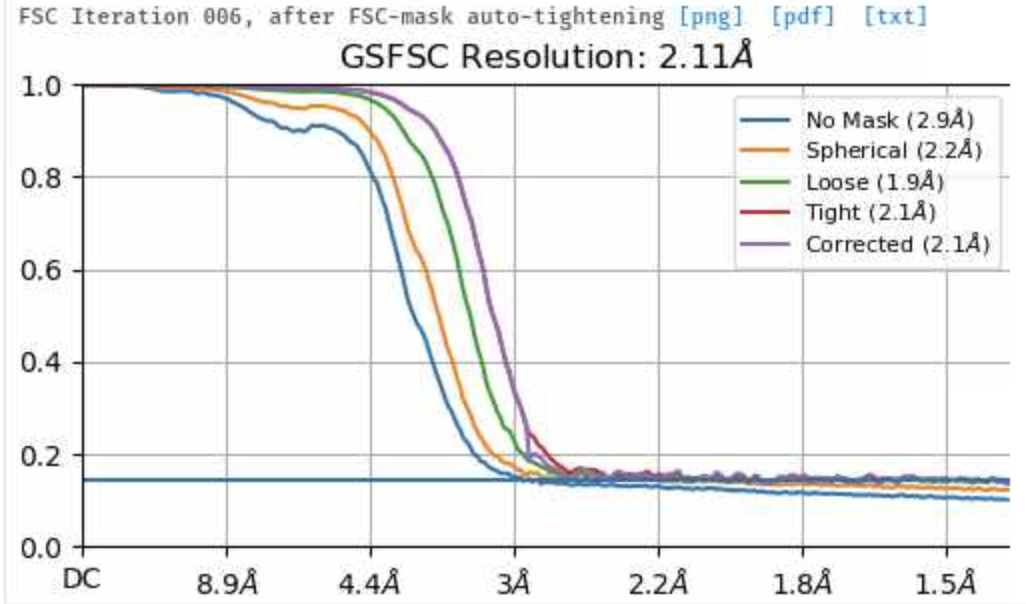
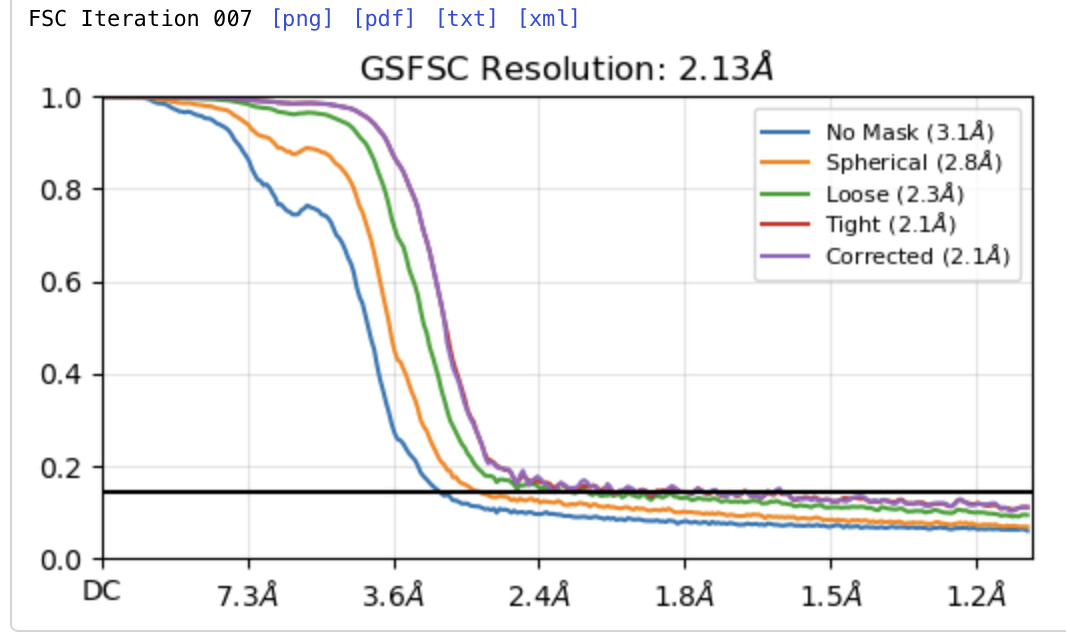
I am pretty new to cryo-EM and in using CryoSPARC. I am processing a dataset right now which give an initial resolution of 2.9 Å. Here the GSFSC plot shows clearly that the curve is reaching 0 and cutting the threshold. After improving the particle picking I could increase the number of particles and achieved resolution to 2.1 Å. Here the GSFSC plot does not show that is reaching 0 and where the curve is cutting the threshold. How can you explain that? Again, the only difference between the two datasets is the number of particles… Thanks a lot for your help!
Hi @MoKret, and welcome to the world of cryoEM!
As you may already know, the GSFSC curve measures the correlation between two independent half-sets of particles. This correlation tells us something about how much of what we observe is signal and how much is overfit noise. (I discuss the GSFSC a bit more in this forum post).
However, if there are duplicate copies of particles in each half set, the correlation between the half sets will never go to zero, because these duplicates correlate perfectly with each other! This type of curve, where you get a nice steady drop which flattens out before it reaches zero, is a classic indicator that you have duplicate particles in your particle stack. If you run these particles through a Remove Duplicate Particles job and then reconstruct them, the curve will most likely go to zero as you expect.
I also will draw your attention to our guide page on common plots produced by CryoSPARC, where we discuss this effect and some others you may see as you keep working through your data. You are always welcome to ask questions here, of course!
I hope that helps!
1 Like
Hi @rwaldo,
yes, that helps a lot!
I will do that. Thanks a lot!
Hi @rwaldo,
it is me again. I have tried to remove duplicates in my dataset and it worked, the curve goes down to 0 again. My problem is now that the resolution got dramatically worse (from 2.1 Å to 3.2 Å). I completely understand that with fewer particles your dataset gets smaller resulting in a weaker resolution. But I have the feeling that some protein orientation were completely kicked out. Do you have any idea how I could get back to better resolutions (maybe not 2.1 Å)? Do I have to find a completely different particle picking protocol now?
Best,
Moritz
Look at your original plot.
The only reason it was listed as 2.1 Å was because of the duplicates - the spurious correlations between your two halfmaps caused by the presence of duplicates meant that your FSC didn’t drop below the 0.143 threshold until 2.1 Å.
Looking at your original plot, 3.2 Å seems like a reasonable resolution estimate.
Also, look at your original map, and the one you calculated after removing duplicates. What do they look like? Does the map get noticeably worse after removing duplicates, or is it just the resolution number that changes?
If you think that you have lost specific orientations of your particle, is there any evidence for this from comparing the orientation distribution plots before and after removing duplicates?
5 Likes
Hello! I encountered the same issue. I want to combine two datasets (new samples, same data collection conditions). I processed the two datasets separately and want to merge the best particles from each dataset for refinement. The pixel size and box size are the same, and there are no duplicate particles. However, after merging the particles and doing the refinement, the FSC still doesn’t reach 0. Could you please help me understand the reason for this?
Hi,
How did you use the remove duplicate particles function? The default 20 A cutoff is nowhere enough in my experience - a third of a box size or higher has worked well.
Hi @huangkun! Welcome to the forum!
Usually the default value works well enough, but like @ggcc says, if you run the Remove Duplicates job and still see the FSC above zero like this, you may need to increase the Minimum separation distance parameter.
Hi,
I’m encountering the same issue. I’ve merged the different datasets and removed duplicate particles, but it still shows no duplicates. Was your problem resolved by increasing the minimum distance? Or is there another solution you found?
Hi @rwaldo I ran into the same issue, now trying to remove duplicate, but how can I figure out what would be the minimum separation distance that would remove duplicates. I assume I would have to calculate it somehow based on my particle diameter and pixel size, I am not sure. Would you tell me how can I get the minimum separation distance for my dataset. I am processing filaments.
If you used the filament picker, spacing should be handled automatically. Helical refinement follows some slightly different rules to standard SPA, where, in effect, “duplicates” don’t quite mean the same thing. Check out the guide for helical refinement, the RELION helical refinement paper (and Shaoda He’s thesis, which is publicly available) and many, many papers by Ed Egelman for more information. ![]()
3 Likes