Hello All,
I have a couple question regarding the outputs from my 3DVA. The brief summary is that I have a virus particle sample treated with and without a test compound. Based on the treatment, I expected to observe a conformational change in the structure, but after applying I2 symmetry and refining it is relatively the same as untreated sample. When I performed 3DVA, I noticed the emergence of a second particle population along component 0 and observed movement when using 3DVA simple display.
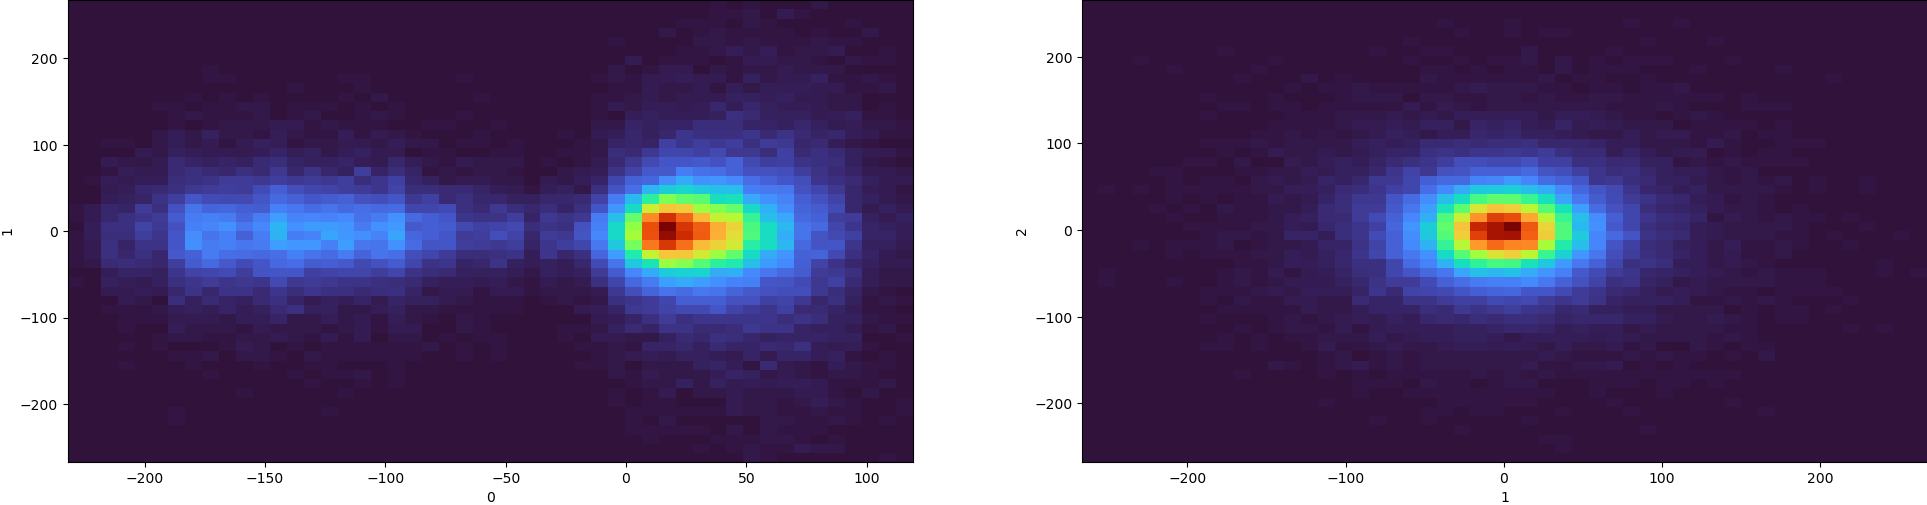
My two questions are 1) Is there a way for me to export the raw data from the component plots to generate a publication quality graph? and 2) Is there any way to extract the particles from the second population observed to rerun ab-inito and refinement.
Also in line with this, are there any publications in which they present these pieces of data? Not quite sure what is the best way to present these results.
Thank you,
Wil