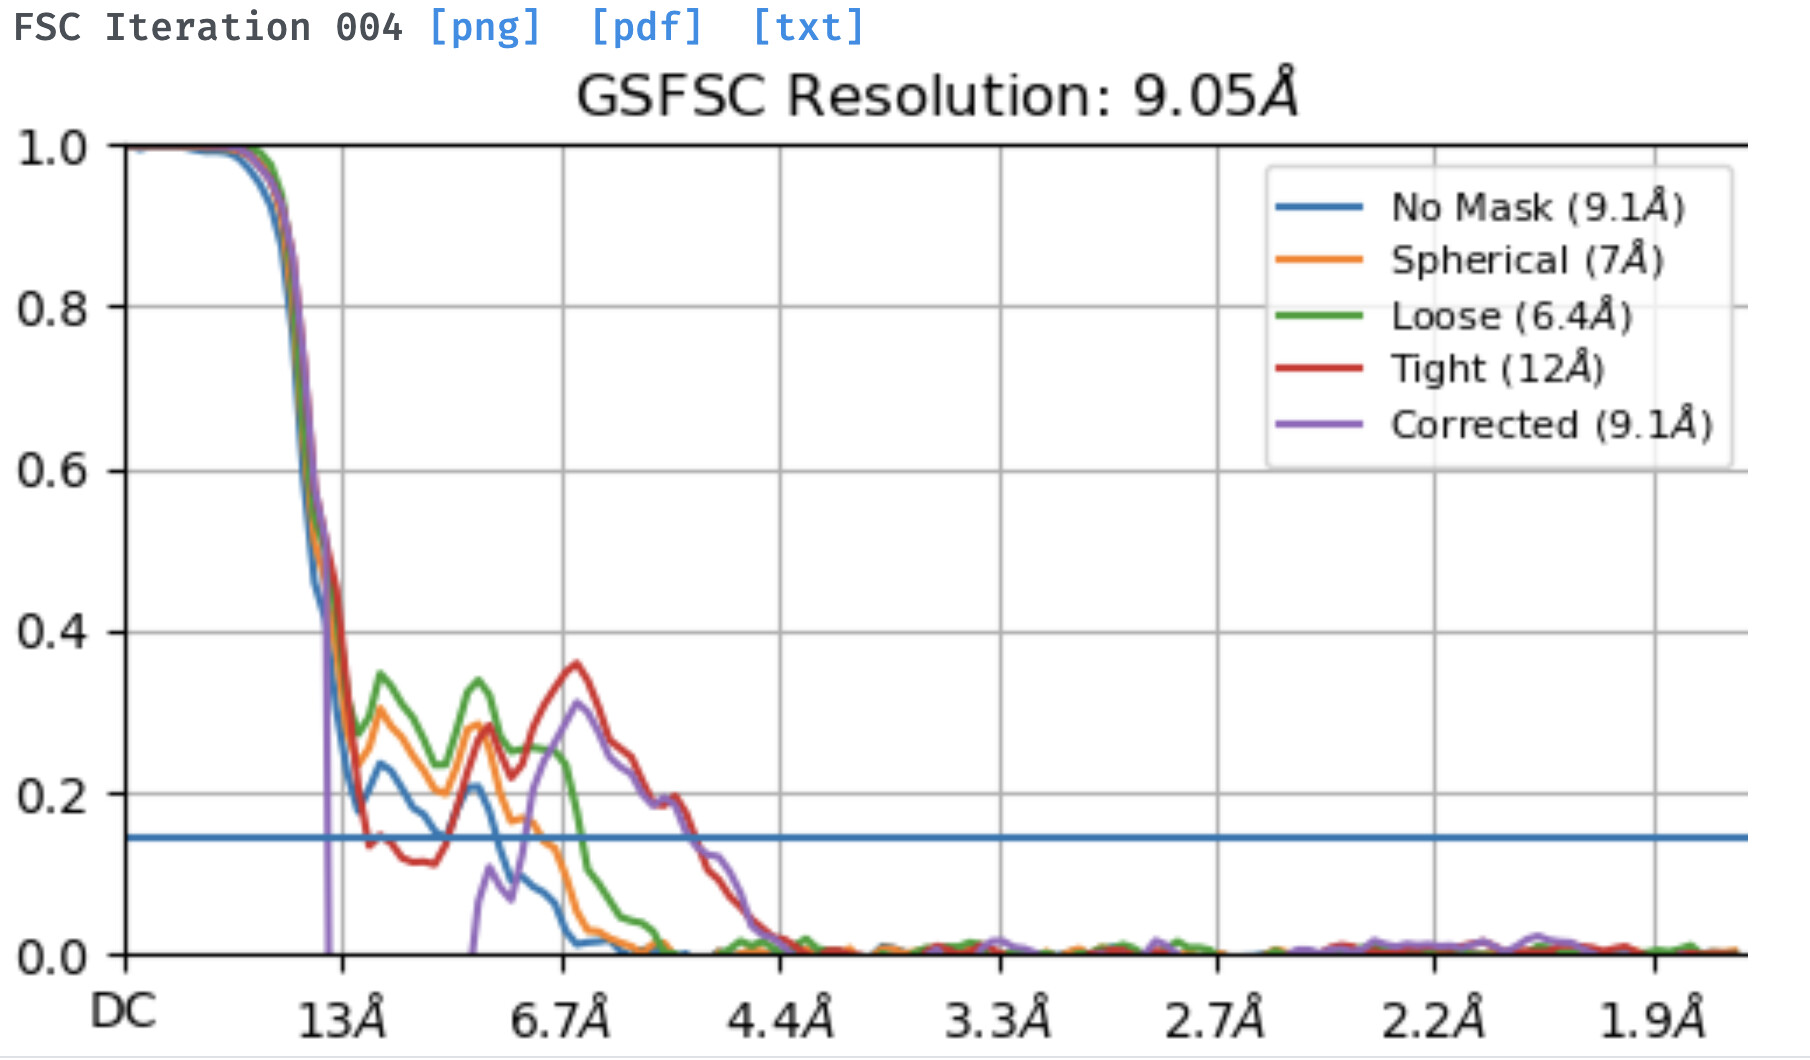
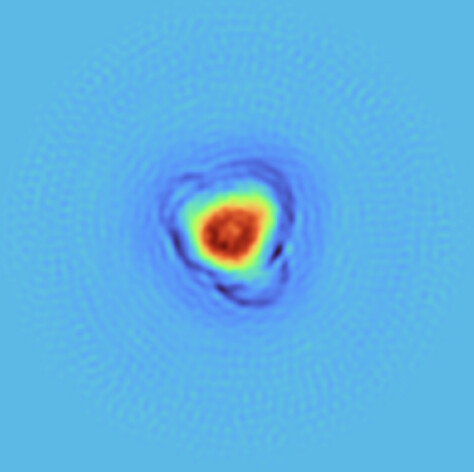
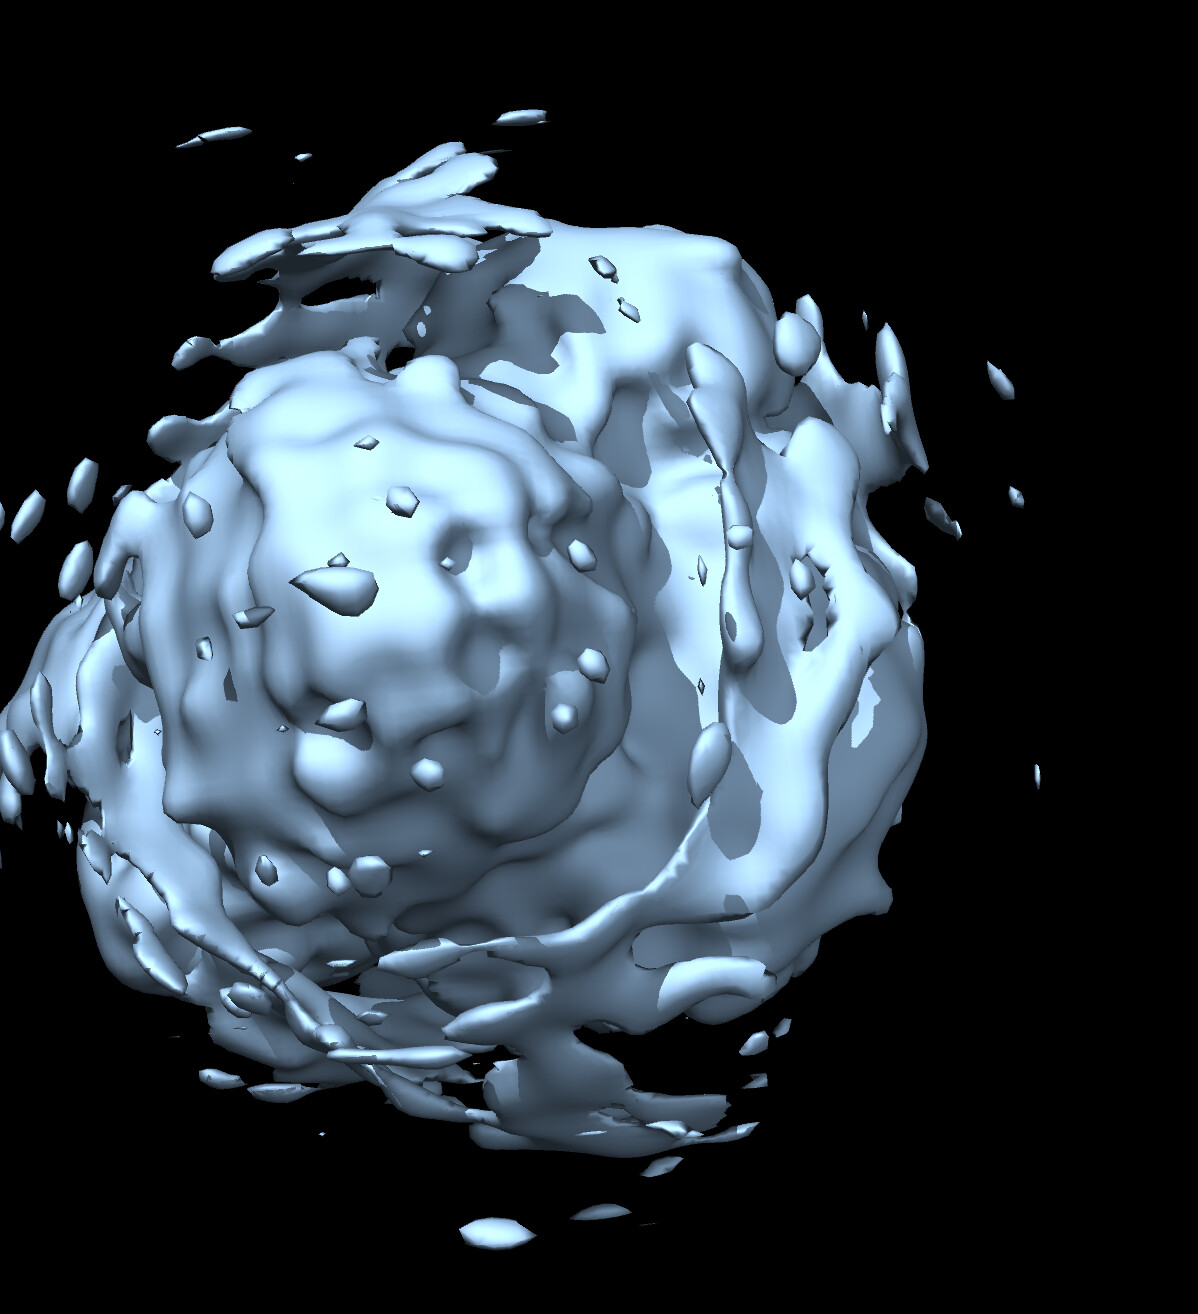
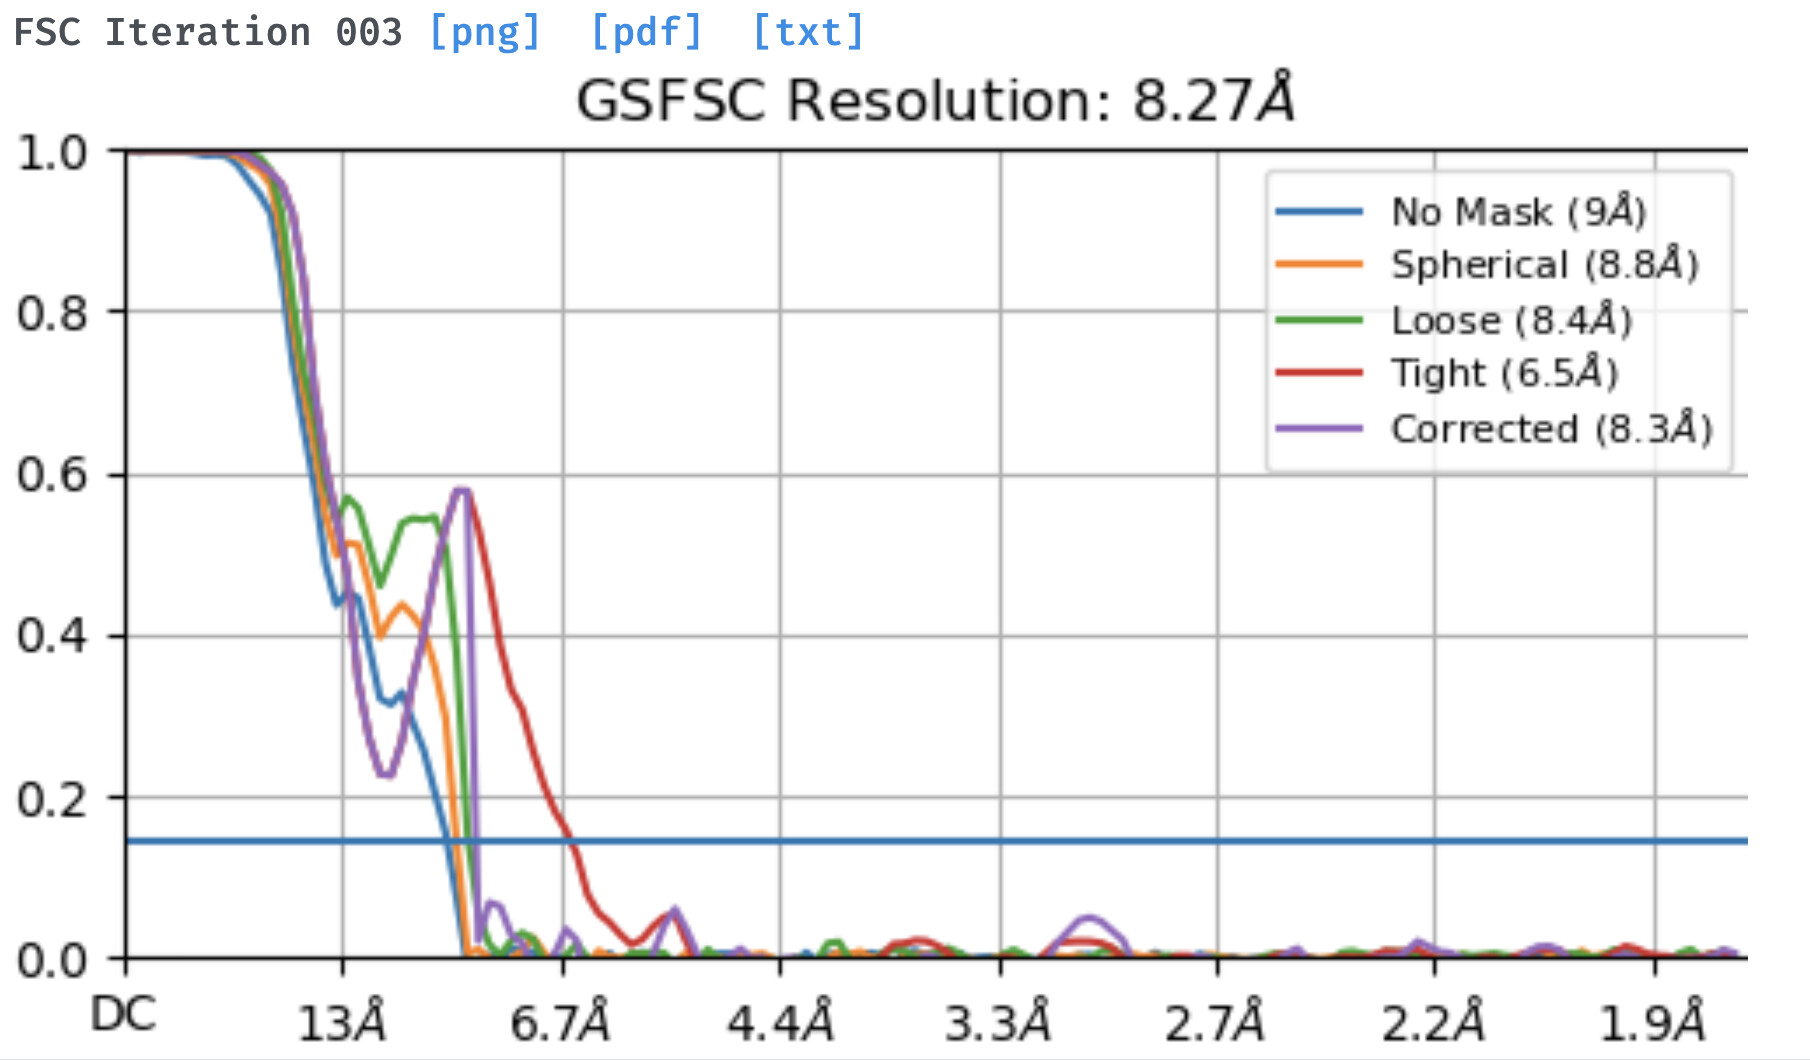
I am working on a membrane protein and using the new NU refinement I get a weird tendency that I can’t get to overcome by changing parameters. The dataset is relatively small, around 90k particles, but the protein is a homooligomer with rotational symmetry. During the initial rounds of new NU-refinement the computed FSCs go down with each iteration and with the auto-increase of the batch size. However the FSC filtered Side A/B graphs appear noisy with noticeable rotational streaks. After iteration 2-3, and especially when using the full dataset, the computed FSC goes significantly up (from 6 to 8-9 A) instead of continuing to go down and the final corrected FSC curve features the notorious sharp dip with resolution worse than that on the ‘no mask’ or ‘circular mask’ curves. The same dataset refines to about 7A using the legacy NU refinement with C1 and although there is a dip in the corrected FSC curve, it is pretty much negligible and far above the 0.143 cut-off. I did refinements with and without symmetry, changing the dynamic mask threshold, increasing the latter’s near and far parameters, enforcing non-negativity, etc.
Has anyone observed such a weird behavior with the FSC estimates during New NU-refinement and especially noisy/streaky reconstruction plots in the intermediate steps. Any suggestions of how to overcome this?
Not much to add, but I have also seen this with very low res datasets. I have seen some cases where something that is obviously very low resolution jumps to 3.5 or 4Å with a huge dip and lots of high res noise, which doesn’t happen with the legacy version.
Hi @PVK, @olibclarke,
Thanks for reporting. @PVK when you say rotational streaks, does that mean streaks radiating outward from the center of the map (i.e. spikes), or streaks radially around the map (i.e. rotational smearing)?
Can you try turning off “Auto Marginalization” and see if that changes anything?
Likewise @olibclarke can you post the FSC curve you got? And can you also try without auto-marginalization?
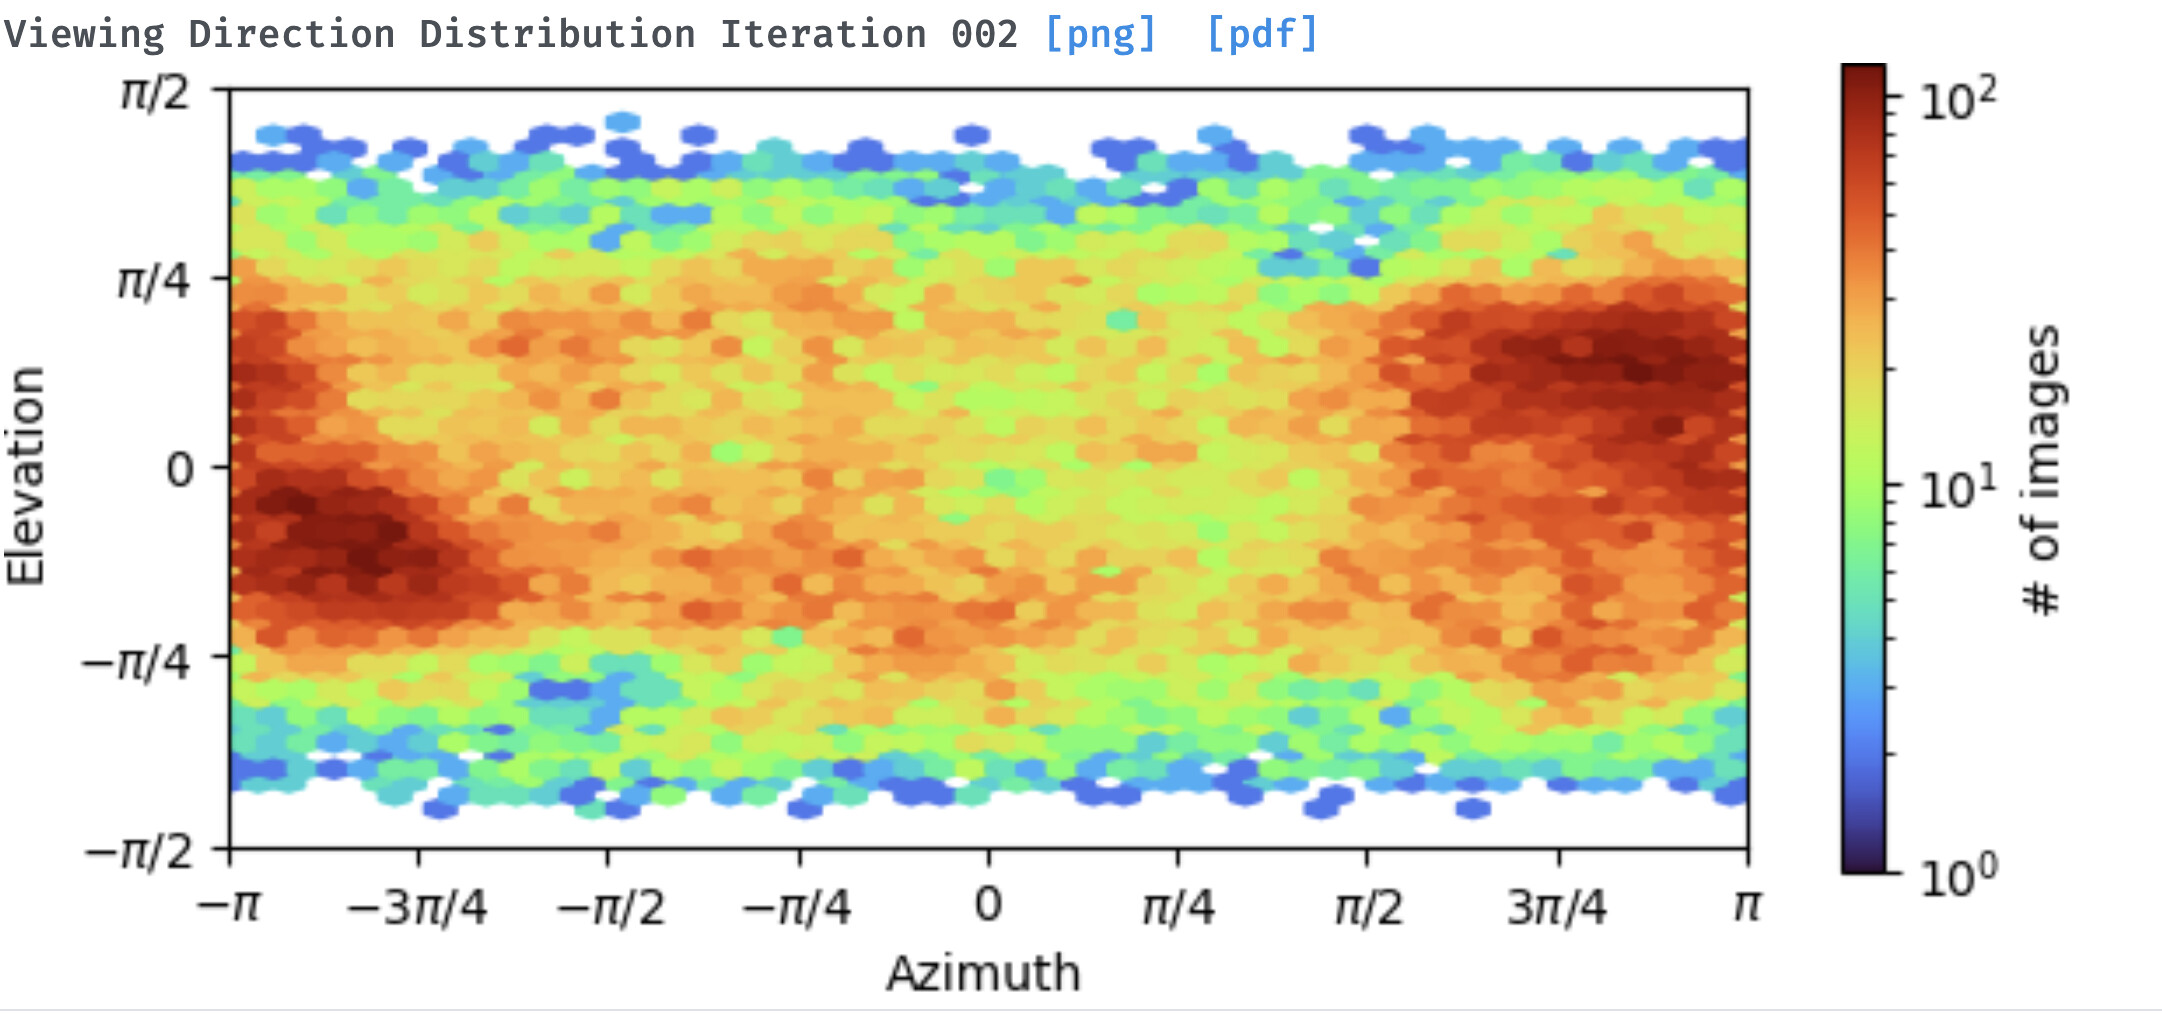
The streaks are concentrically around the center of the map. I will try turning off the Auto Marginalization and let you know if it improves. The micrographs are at 3-3.3A resolution on average and the 2D classes look promising given the small number of particles (i.e. TM helices visible in 2D) but the density of particles in the ice is very low. Do you think the small number of particles per micrograph and not only the total number of particles can also negatively affect the reconstruction resolution?
@PVK likewise thanks for the fast reply!
In general yes the concentration of particles per micrograph being low does negatively effect reconstruction, because CTF fit accuracy degrades with less signal per micrograph. However, if you’re seeing good CTF fits and you see details in 2D classes, more likely we’re limited by orientation distribution in 3D, or number of particles. If there are strong preferred orientations it’s likely to see high detail in a few 2D views, and still not be able to get a decent 3D refinement (though I wouldn’t say we can say that’s what’s happening in your case yet!)
Thanks for the tips, we are working on getting more of those particles in the ice. I will keep you posted if any parameter combo seems to improve things.
Hello, I am having similar problems with my protein. It is a an elongated dimer (~ 100 kDa). I performed several rounds of heterogeneous refinements to get rid of some of the heterogeneity. The 2D classes look alright, but there is some preferred orientations. The ab initio 3D model doesn’t look bad, but I haven’t been able to get a reasonable refined map.
The FSC curves are all over the place (both with regular refinement and NU refinement); and even when the FSC curves look a bit more normal, the actual map has clear artifacts such as ‘shells’ of density in the solvent area.
This is how it looks with regular refinement (default settings).
@apunjani@olibclarke do you think it could be related to the size of the box? The particle is quite long in one dimension (~120 angstroms) but very small in the other dimension (~ 45 angstroms). Any help is greatly appreciated!!
@bonils
Please let me know if you get any further with this issue! My protein has basically the same shape as yours and I have similar problems. What helped me a lot to get a good starting model was to decrease the maximum/initial resolution of the ab initio job to 5/7 Å. I also saw some improvements by decreasing the Initial lowpass resolution to 12 Å in refinement jobs.
I suspect that preferred orientations might be the culprit. I have just collected a tilted dataset and hope that will help out a bit.
With my reconstructions, the weird FSC curves usually arise in early stages of refinement when there are still significant # of “bad particles”. Subsequent rounds of 2D classification/het refinement has usually been helpful in filtering out the bad particles, although the “resolution gets worse”, the FSC curves usually tend be more believable.
In my hands the shells of density have appeared when my mask is not soft enough or my box size is not big enough. Whenever I see these weird features appear in the refinements, I try to keep the mask static. (The circular mask diameter has not made things any better or worse for me.)
Not sure if the above makes sense or would help you but it seemed to have helped with my reconstructions.
I agree with @schow
My reconstructions had similar shells of density when the mask was either too tight or when there was still heterogeneity in the particle stack. My refinements improved after separating different states by hetero refinements, 2D classification and 3D variability analysis before refining each 3D cluster independently. With those refinements I could tighten the dynamic mask without causing artifacts.