Dear all,
I am analyzing a dataset collected from a 300kV microscope using Apoferritin grid. The pixel size is 0.96 A (not calibrated by the model fitting yet) and particle images were not downsampled when extracted from images. Box size was set to 256 pix.
Would anyone explain why the FSC plot did not drop to zero? Is this a problem to use the plot like it is, or can it be improved by using a larger box size? Many thanks for any comments!
1 Like
Your resolution is very high, congratulations! You are hitting Nyquist (resolution limited by sampling), and may want to check out https://www.biorxiv.org/content/10.1101/2023.06.09.544325v1
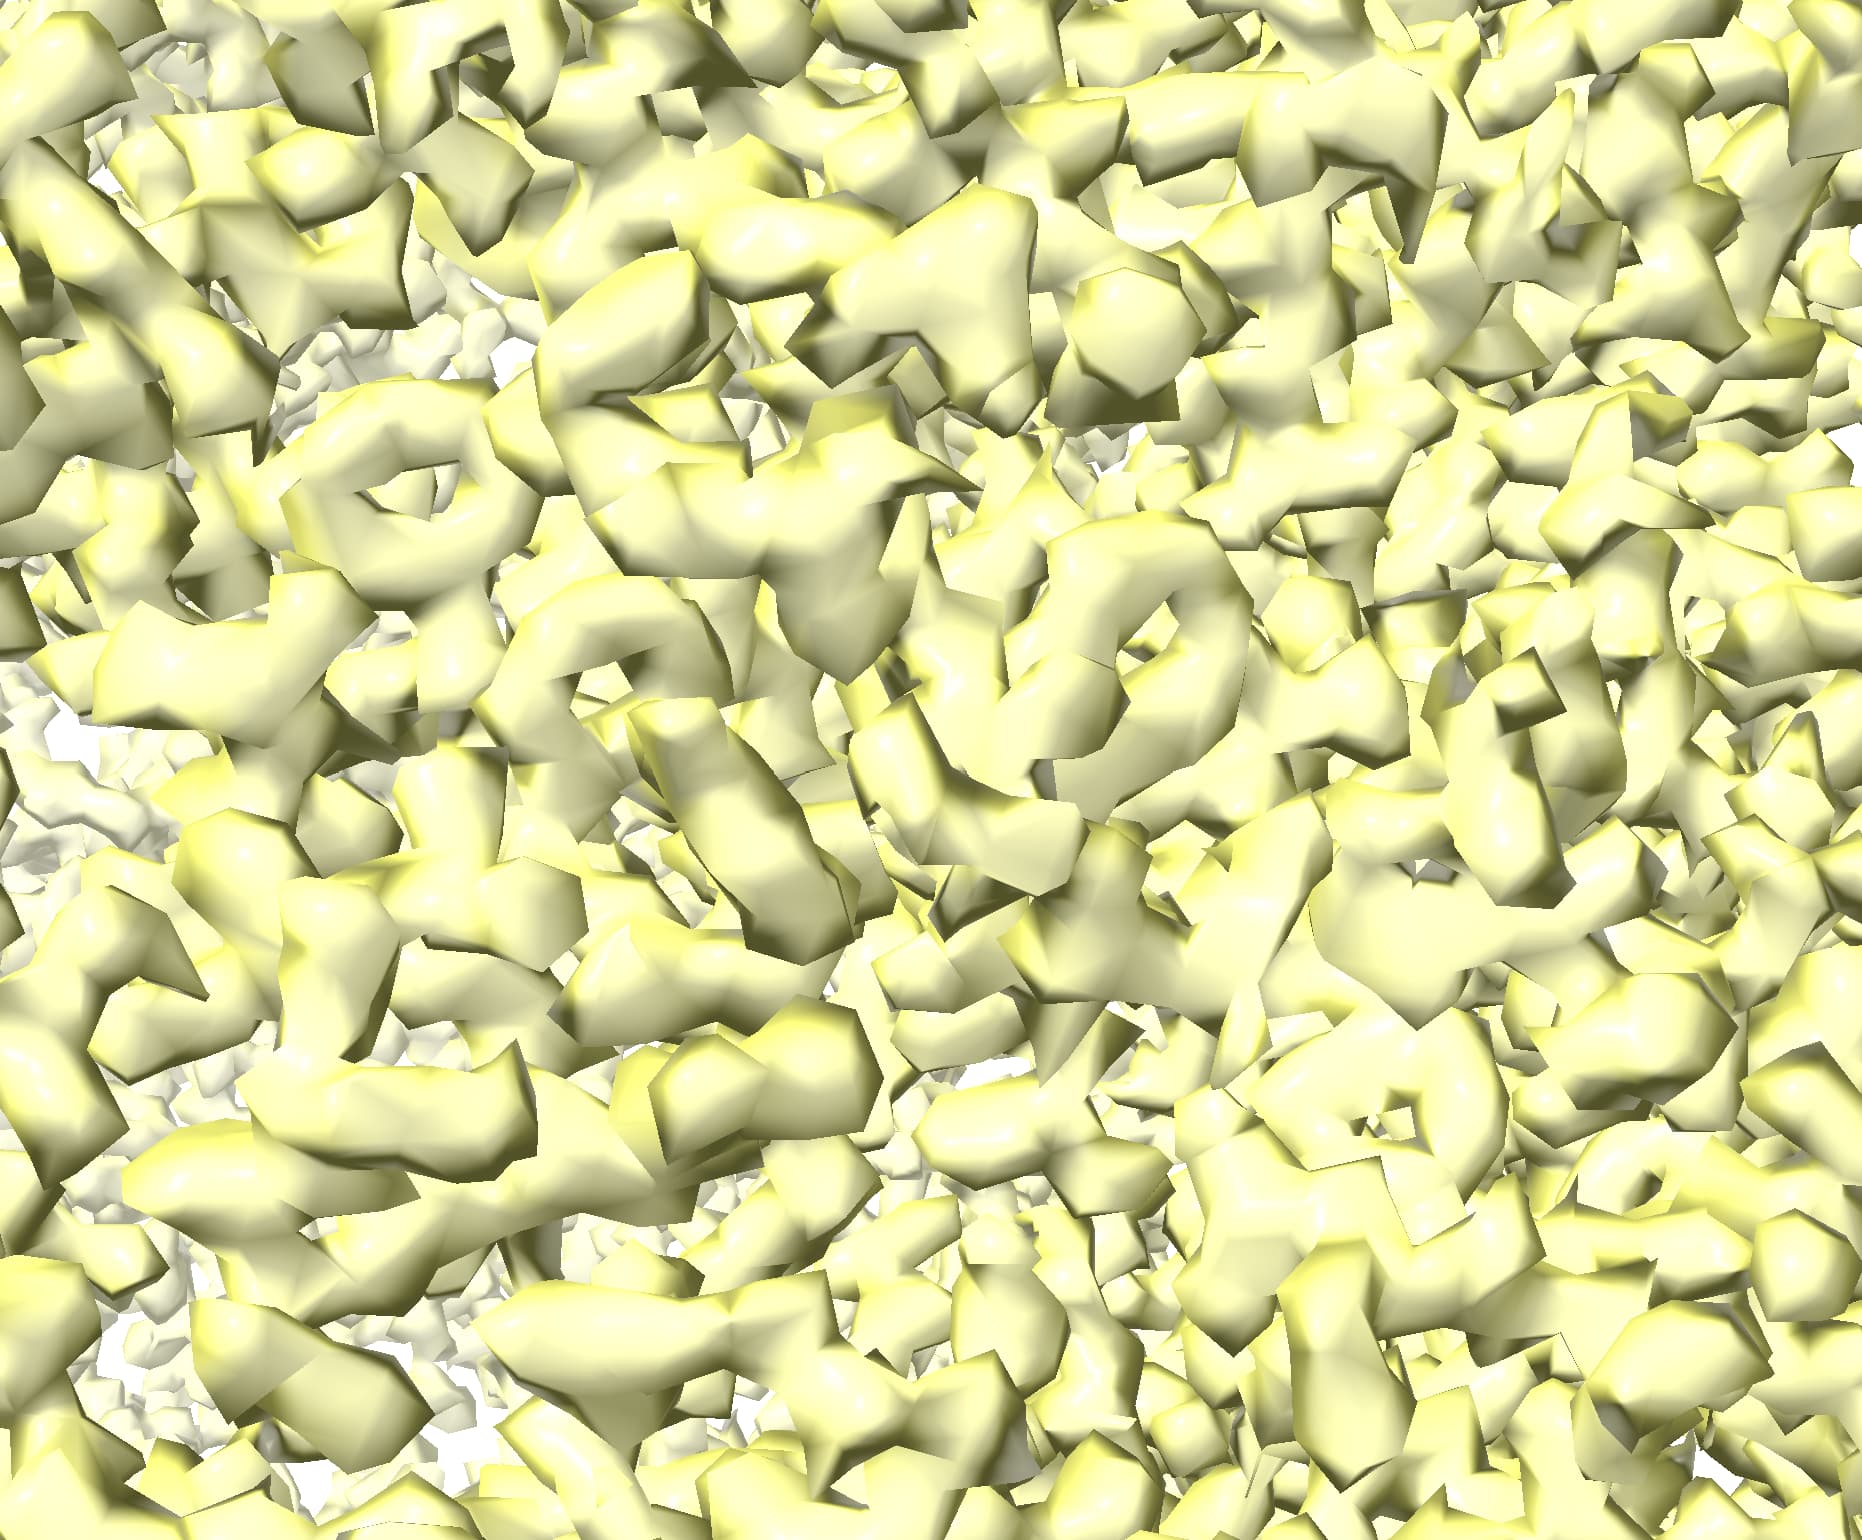
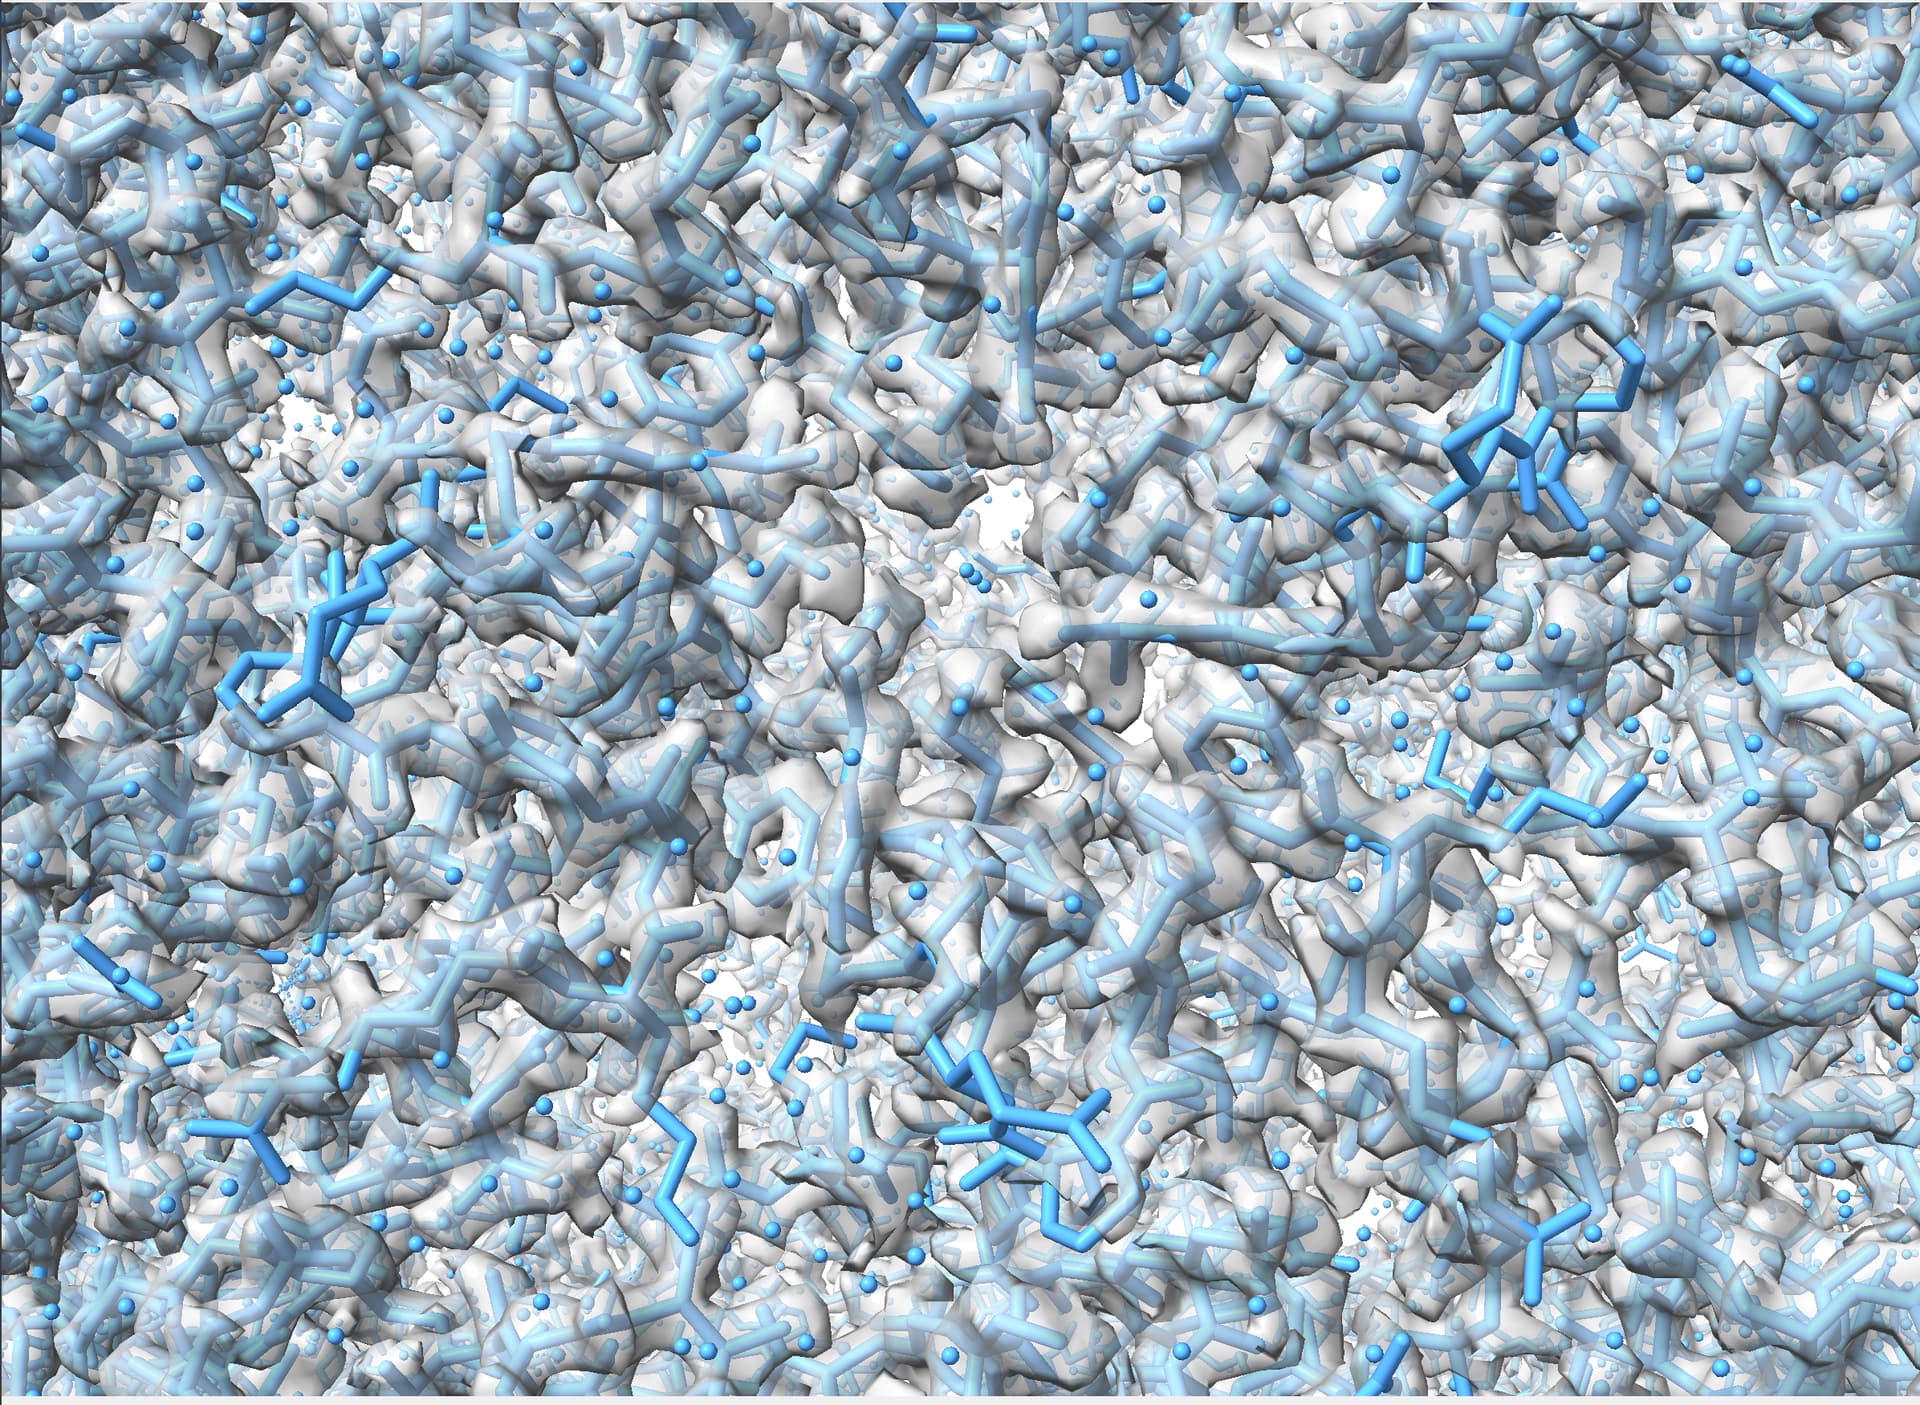
Can you see features in the map corresponding to this res? At this resolution you should see holes in tyrosines, clear spherical waters, clearly defined density for backbone carbonyls
3 Likes
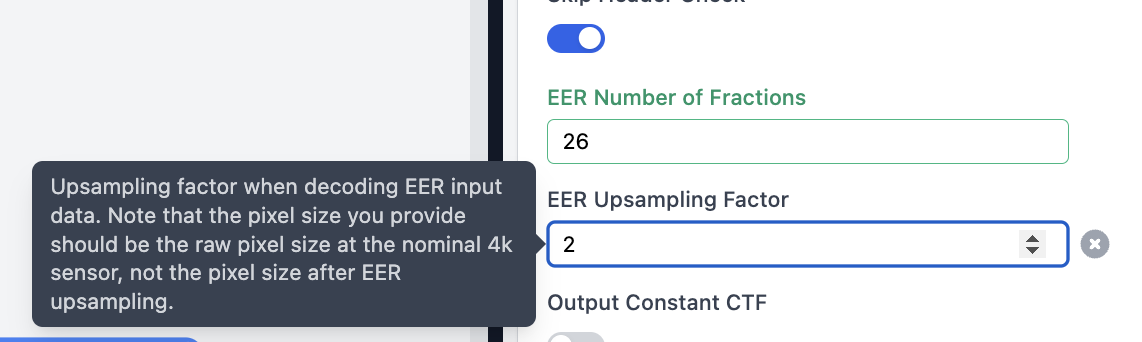
what is the detector writing movies as, .tiff or .eer ? If you have a Falcon 4/4i, you can up sample raw .eer movies by n=2. This will greatly increase box size and computational time.
1 Like
Many thanks for the comment olibclarke, and yes, the resolution is high enough to be able to see holes in tyrosines. Please refer to a snapshot of the map.
2 Likes
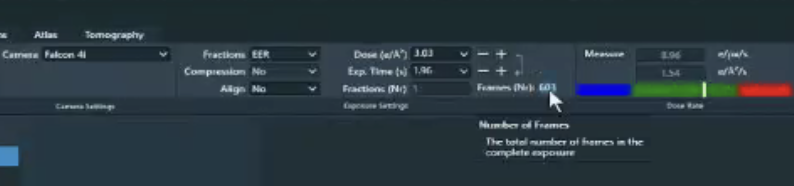
Thanks for the comment Mark, and it was .eer collected from a Falcon4i camera. I did not mean to achieve high resolution but to calibrate the pixel size, so I did not try to upsampling the data except for the motion correction process.
Hope it is going well @Jason.G
If I do have .eer format, myself and others here have always said, [paraphrasing] “it is an interesting experiment to upsample to 8K, *if you have the time and resources.”
I usually fully process in 4K and then re-assign those particles to micrographs that are imported with upsampling = 2 and 0.5-1.0e/frame - they also go through patch motion correction, and patch CTF est.
Also with .eer and the Falcon4i it is getting hundreds of frames per movie, not hard set at 20,40,60,80 as for .tiff. I have seen slightly different results here as well if you want to change dose/frame.
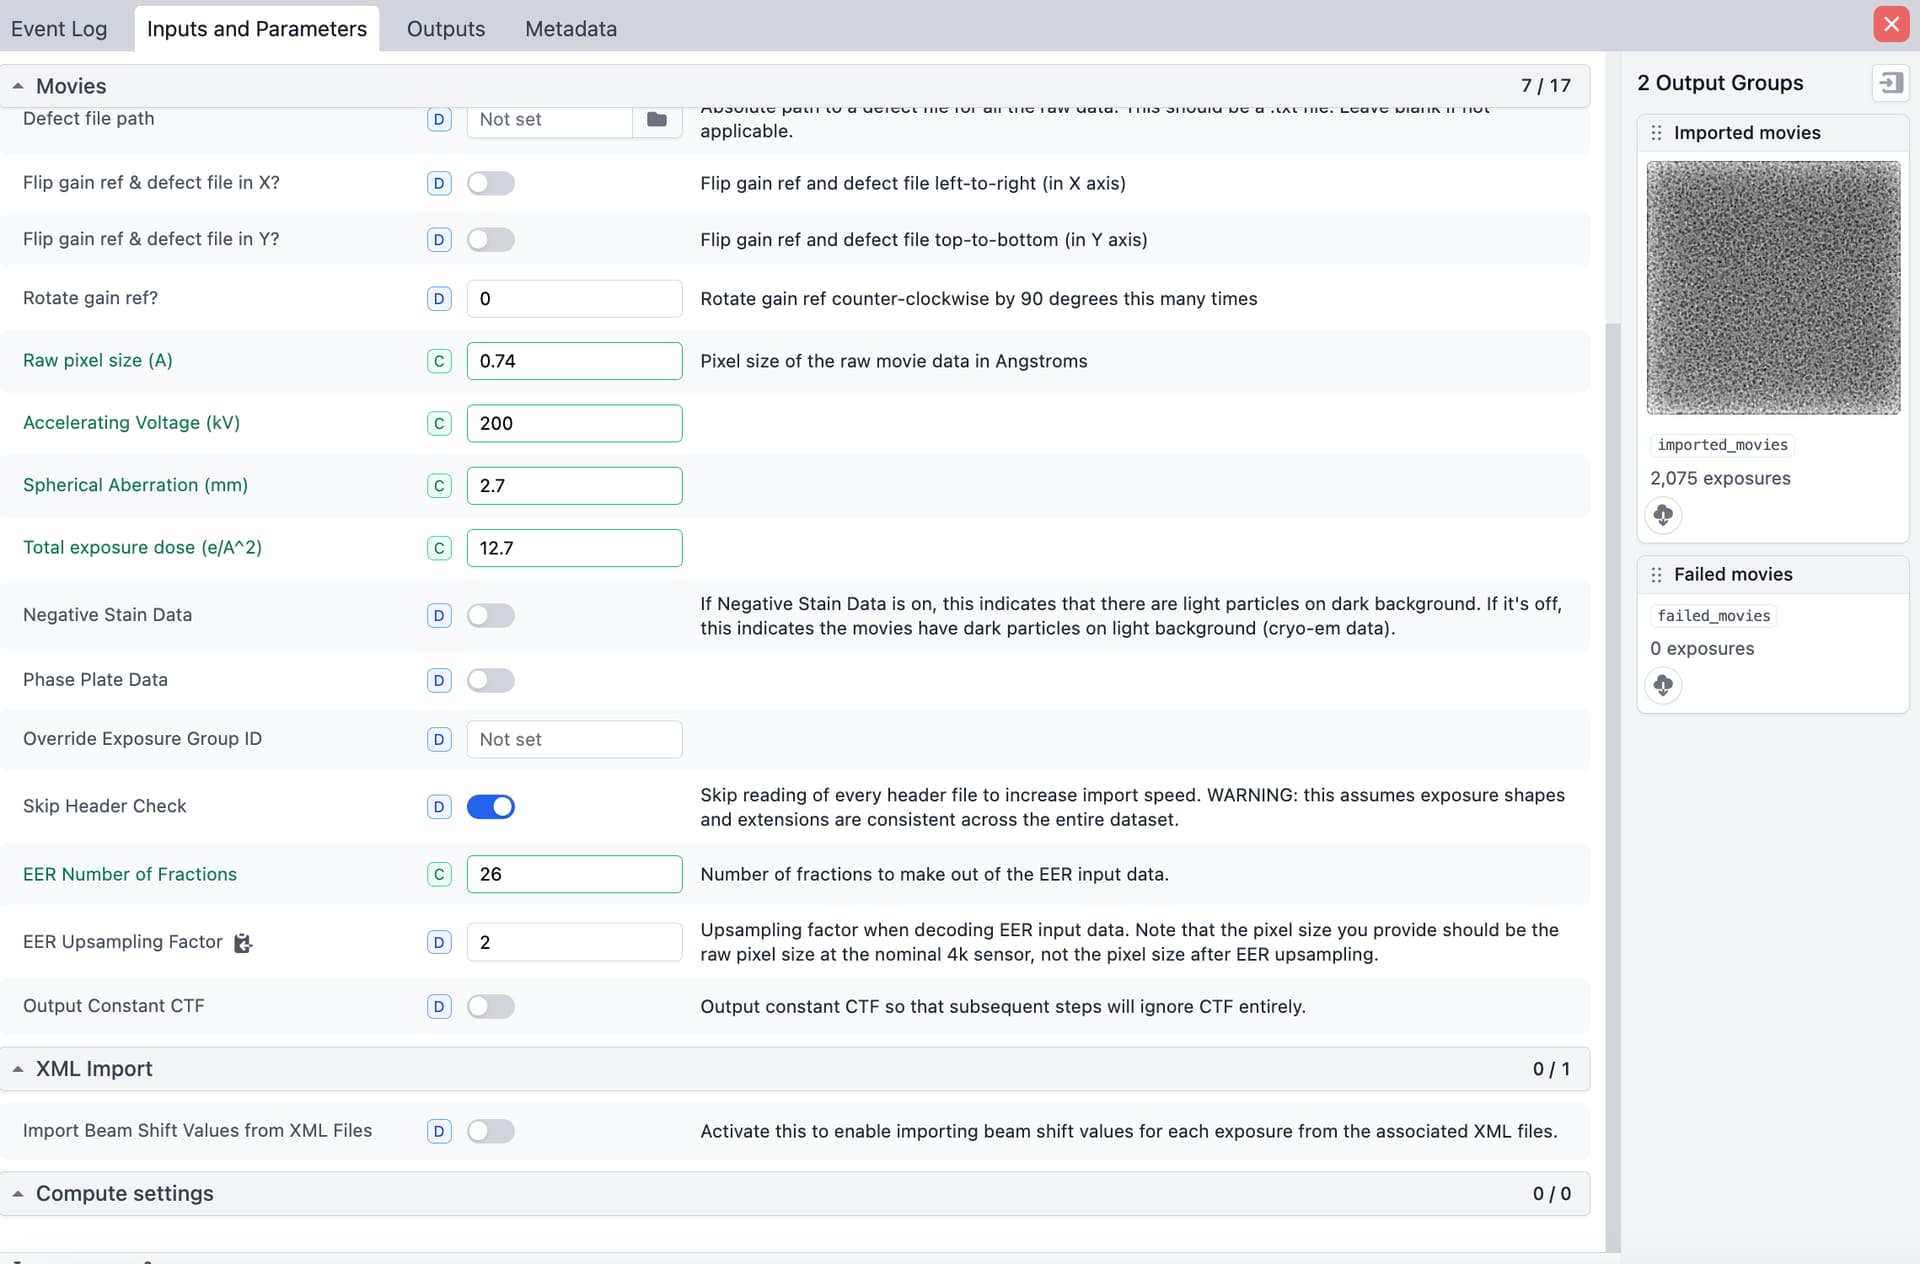
If using AFIS you can also include the metadata for each optics group (the .xml files) https://guide.cryosparc.com/processing-data/tutorials-and-case-studies/tutorial-epu-afis-beam-shift-import. Not sure if it helps much for calibrations.
3 Likes
Excellent guide!
Just to add, unless I’m working at very high mag (0.5 Angpix or smaller) I usually import with upsampling 2 as I’ve lost count of the number of samples I wasn’t expecting to hit physical Nyquist and did. At 0.5-0.8 Angpix it’s a toss-up, and depends greatly on what sort of sample I’ve collected whether I upsample or not. At 0.9 or larger, I basically always work in 8K (I’ve done 16K once, and even broke super-resolution Nyquist, but that was in RELION - which was fun in itself as RELION no longer supports 16K sampling and supported it spottily when it did - and some time before CryoSPARC had RBMC)…
2 Likes
Hi Mark, I appreciate your wonderful experience! Yes, I used to import the raw eer movies in 8K (upsamping factor 2) and then Fourier crop them back to 4K after patch motion correction (output 1/2) to save space. As you suggested, I also recommend my microscopy users to keep the .xml files to process their data. So far, few people (including myself) have tried the optics group yet.
1 Like
Using EPU, the optics grouping via xml will make a huge difference on larger datasets when “Faster” collection is enabled - by default, EPU will shift up to… 12um (I think, need to check, but it’s 12um on our Titan)… and it’s not a user exposed parameter so with standard QF R1.2/1.3, you’ll end up with 69 optics groups most of the time (a 7x7 grid, then an extra 5 on each edge). Correct grouping will make a significant difference - the difference between 1.56Ang and 1.24Ang in my hands with an apoferritin test set (although I could probably push the 1.56 a little further…) on a more “normal” sample (D2 symmetry) correct optics grouping made the difference between 2.1Ang and 1.9Ang (before RBMC was a thing)…
If using a newish version of EPU (3.17.1 I think is what we currently have) then TFS have added beam shift group numbers into the filename (finally!) so the xml isn’t critical any more. Sadly, there are a number of really interesting datasets on EMPIAR which do not have the xml data for correct beam shift grouping. ![]()
I’ve not tested it extensively, but I’m dubious as to the value of importing with 8K sampling and Fourier cropping during motion correction vs. just importing at 4K? I only tested on one dataset and saw zero difference on final result (0.01Ang is not measurable) but I’ll admit it wasn’t a particularly large dataset, so… I’d be happy if someone demonstrated otherwise. ![]()
2 Likes
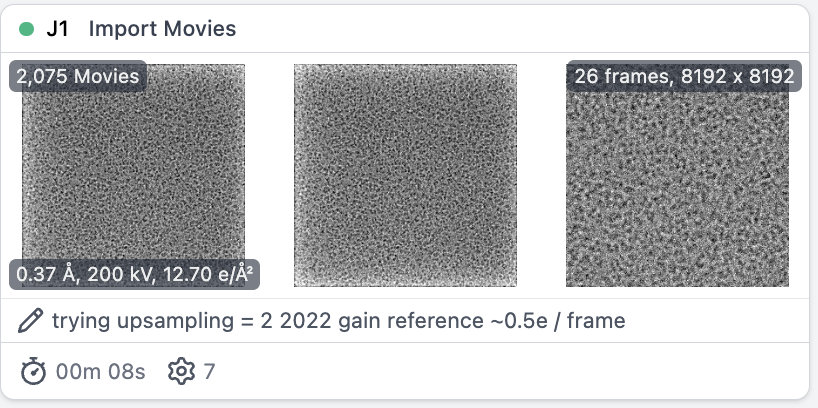
This is great suggestion. I am testing the optics grouping and upsampling eer files. The result will be updated later. Another question here is when I header the eer movie file, it shows that the numbers of columns and rows are 16384 16384, which look like a “super super-resolution” mode of the falcon4i camera (4096 x 4096). I am curious how are these numbers calculated?
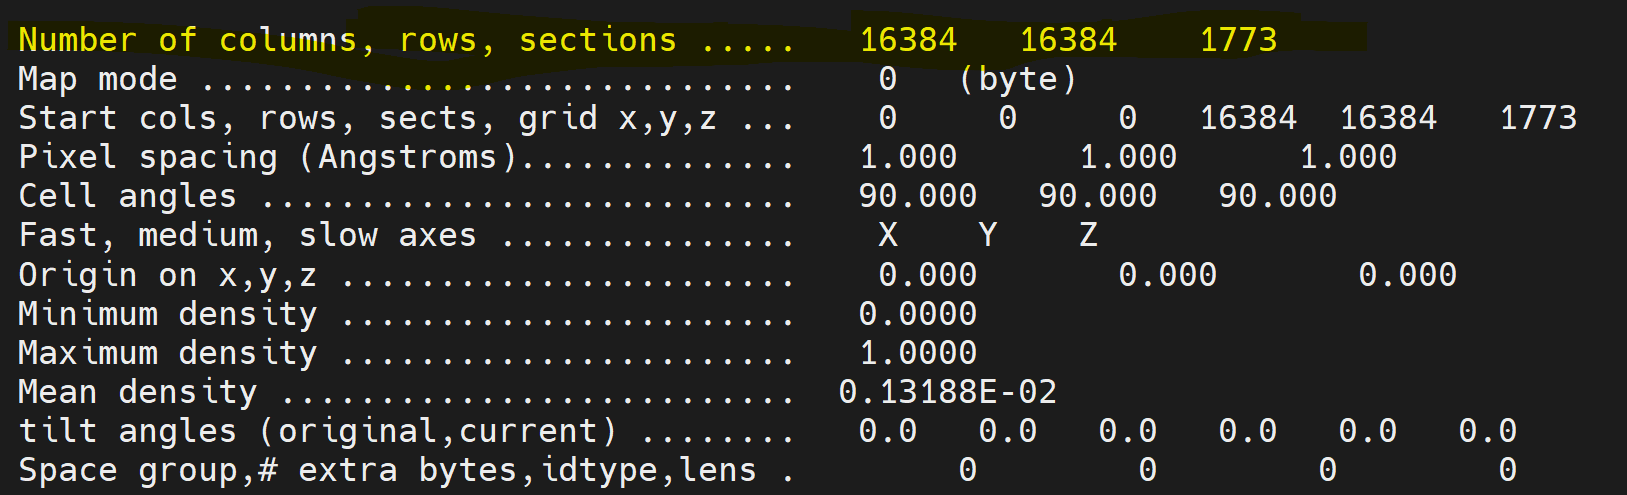
The Angpix pixel numbers are nonsense (they’ve never changed for me) but the EER format (and the Falcon 4(i) camera(s) supports 4K (native sampling, as sensor is 4Kx4K pixels), 8K (super res quadrant sub-sampling) and 16K (double super res quadrant/quadrant-sub-sub-sampling). Signal dropoff in 16K mode is extreme, you need a ton of frames to compensate.
DSR is supported in CryoSPARC (although I would not recommend it) but not supported in RELION (any more). It used to be, technically, but it was extremely buggy (often being read as 12Kx12K) and support for it has been removed. I did raise this with Nakane-san, but I don’t think it’s going to make a comeback unless (a) DSR DQE gets better (it falls off fast after super res Nyquist) and (b) way more people than just I kick up a demand for it. It is possible to get reconstructions past SR Nyquist - I’ve managed (and made public on EMDB) 1.78 Å from a physical Nyquist of 3.824 Å and SR Nyquist of 1.912 Å but you need big, big systems to deal with the size of the micrographs, especially if Bayesian polishing/RBMCing.
2 Likes
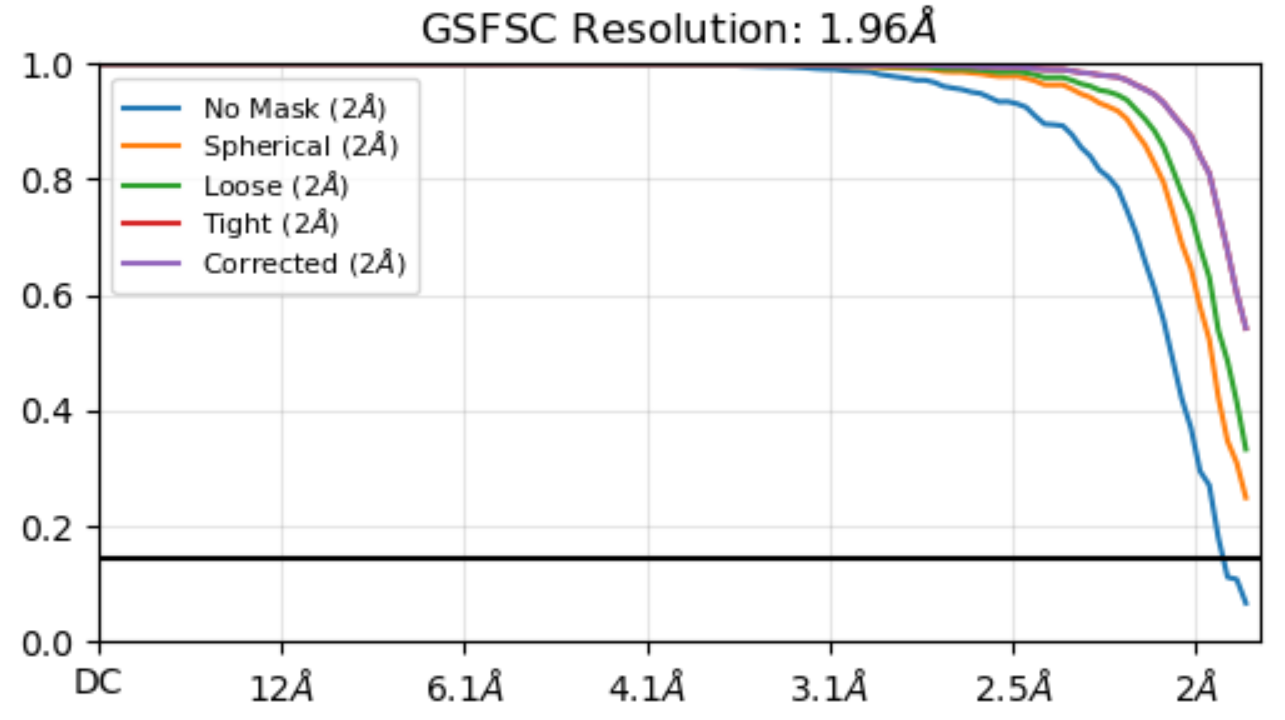
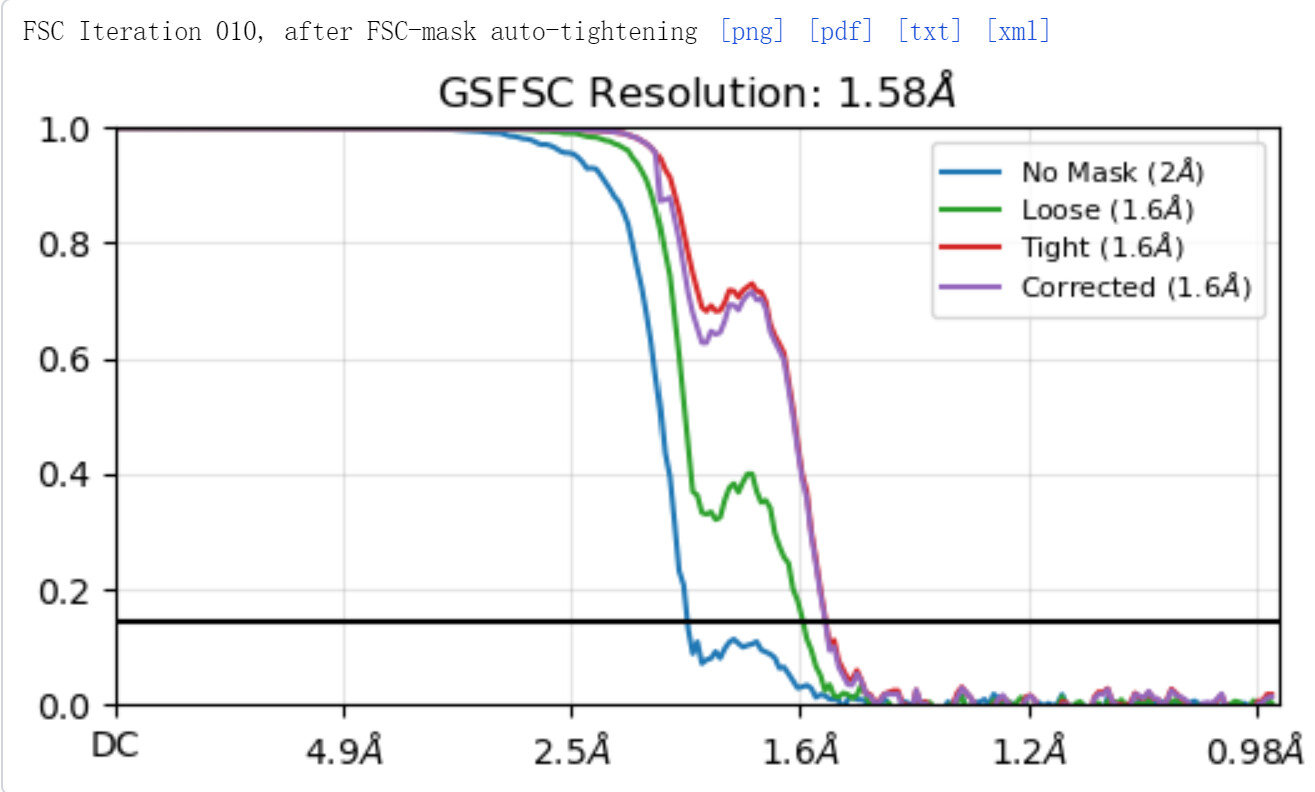
Thanks for sharing the message! I tested the optics grouping and upsampling factor 2 (so 8K movies) with the same dataset. The GSFSC reached to 1.58A from originally 1.96A. It seems these advantages can push the resolution better at least with the apoferritin sample. As the GSFSC attached, there is a dip and peak of the curve. I have been searching the link of Cryosparc guide explaining such dip and peak, but haven’t got any clue yet. Do you by chance have any idea about this phenomenon?
1 Like
Looks like beam tilt needs more optimisation. Also check your shift groups are sane.
Did you do global CTF refinement in NU refine? I find it tends to drift off and the reconstruction either gets worse or just outright descends into noisebomb territory sometimes. Check your 4th order tilts in the log, that’s the most immediate diagnostic.
Also, I now only do global CTF one parameter at a time, and usually do mag aniso several times in between beam tilt runs; if it stays fairly stable I’m happy, if it drifts off or jumps around I get worried about how well the 'scope was set up.
How well calibrated is the pixel size against, e.g. 7a4m or 2cih?
2 Likes
The shift groups seems fine to my eyes. I did global CTF refinement just in Homo Refinement, and enabled the “Optimize per-particle defocus” and “Optimize per-group CTF params”, and left the others as default, which means the “Fit Anisotropic Mag.” was not enabled. The pixel size was calibrated with 4y08, and it fitted well as shown in the attached image.
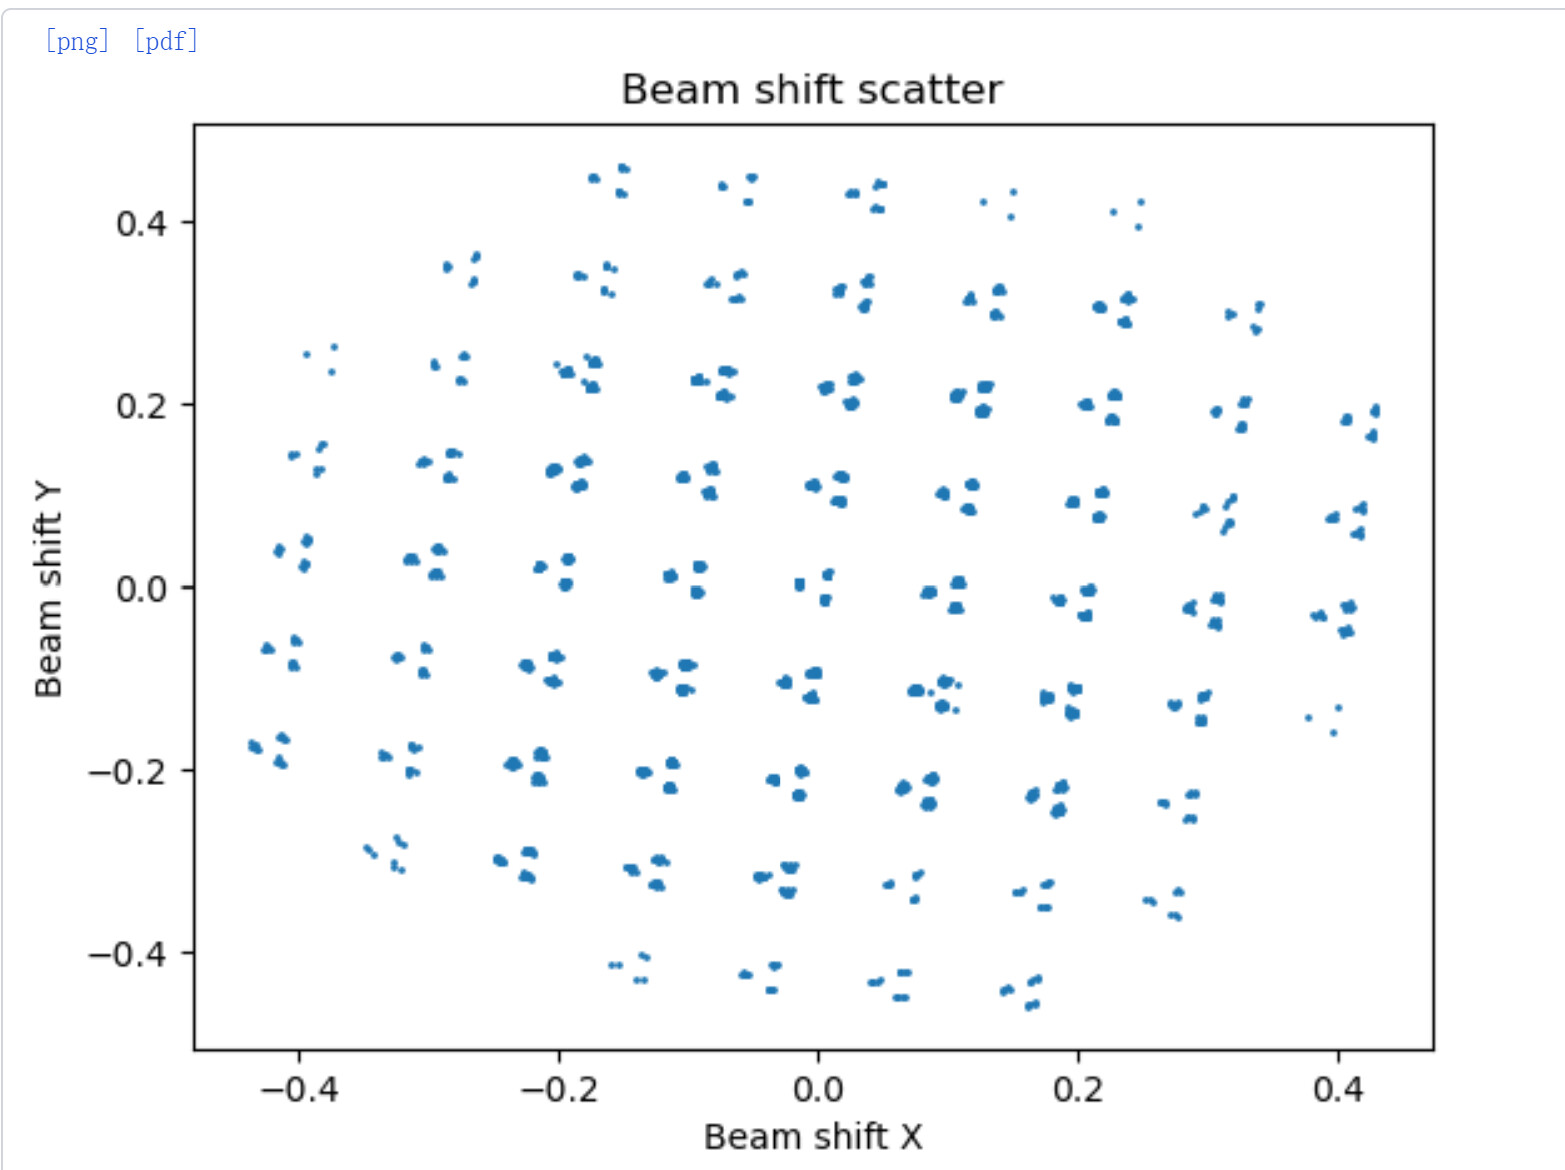
Is that the shift grouping from input? It doesn’t actually split by group during import, you have to do that in a separate job (Exposure Group Utilities, action Cluster and Split) so it colours groups appropriately (e.g. below).
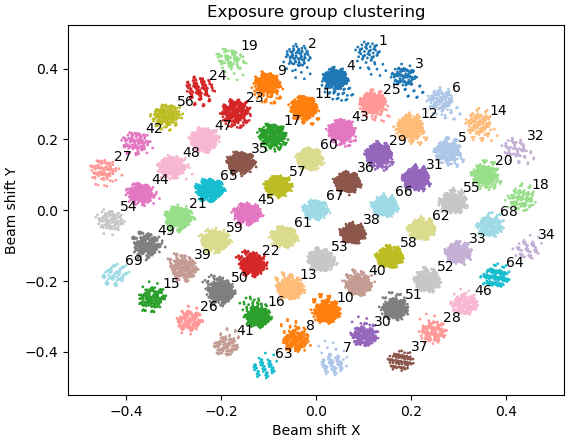
So if you’ve not cluster ‘n’ split, it’s still doing just one optics group. ![]() The scatter you posted should split into 67 groups neatly (7x7+5+5+4+4) although some groups may be a little low occupancy. Fortunately you can split optics groups for particles as well (and it’s a lot easier than doing it in RELION as starparser is needed if particles are already extracted…)
The scatter you posted should split into 67 groups neatly (7x7+5+5+4+4) although some groups may be a little low occupancy. Fortunately you can split optics groups for particles as well (and it’s a lot easier than doing it in RELION as starparser is needed if particles are already extracted…)
As I said, I avoid doing any CTF parameter refinements during a 3D refinement now due to poor results sometimes (use the dedicated job instead, it seems to give more stable optimisations). The model fit indicates it’s not pixel size calibration causing the dip, although pixel cal errors are usually much more severe it was worth a check.
1 Like
Oops, I attached a wrong image. I did cluster ‘n’ split in Exposure Group Utilities job, and as you said that it was split into 67 groups. When you said you would avoid doing any CTF parameter during a 3D refinement, do you mean you will do global CTF refinement after finishing the Homo refinement?
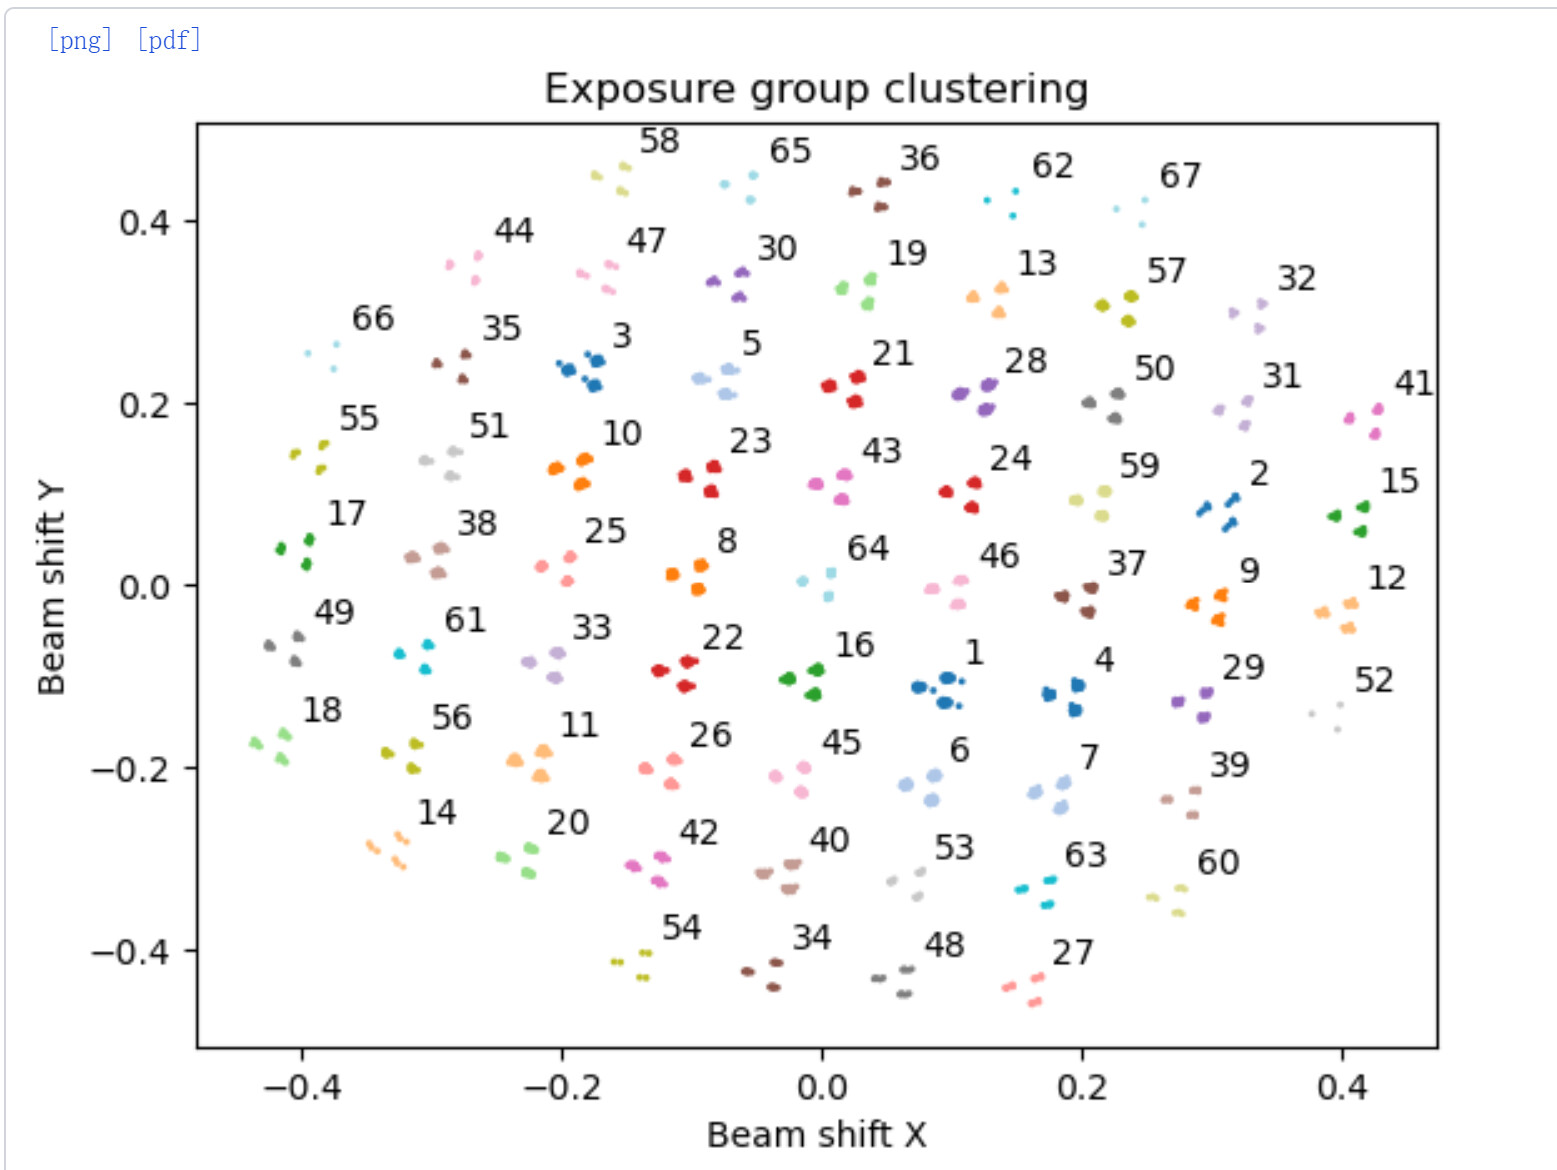
![]()
Correct. Although for apoF, a reasonable default path is; NU-ref (w/defocus), global CTF (aniso mag), global CTF (beam tilt, trefoil), global CTF (tetrafoil), NU-ref (w/defocus)… but everyone has their own strategy there and different datasets might need some tweaking. ![]()
Might also be some junk hiding in the particle set.
1 Like
Wow, this is a delicate path for analyzing apoF, compared to my single Homo Refinement (with default parameters except for enabling “Optimize per-particle defocus” and “Optimize per-group CTF params”). I will test your strategy sometime later. I appreciate your sharing~!
I love to see that @Jason.G. Upsampling was just a small part and the input from others here really shows how helpful this community is.
Sorry that you have increased your disk space and processing time - hope it will be worth it.
The FSC looks improved, but that dip could be from anisotropy (likely not if ApoF). The masking could be improved. Great progress
1 Like
Thanks Mark for the comments. I am more than happier to increase my disk space and processing time to improve the FSC. I have been enjoying the community here because of people like you and rbs_sci.
4 Likes