Hello,
We have obtained conformational differences in a protein complex using heterogeneous refinement. Interestingly, of the three maps with different conformations, two seem like they have been compressed just a little bit in volume. That compression is significant enough to throw off fitting in chimera. The third map is fine however in its fitting of coordinates. Any advice on how to troubleshoot this, please? Could this be an issue with different depths because certain conformations preferentially go to air-water interface or a different ice thickness and thus have a different defocus? Thank you.
1 Like
We have recently seen this too, and I’m not sure what to make of it - we have different classes that appear to differ only in effective magnification/pixel size, even though they all derive from the same dataset, collected in a single session. Aniso mag seems insignificant.
If anyone has suggestions as to data collection parameters that might cause this I would be keen to hear them too!
@olibclarke, this is interesting that you notice this as well. I am wondering if I should try to optimize the pixel size for these compressed maps? Perhaps plot the PDB-to-map correlation as a function of pixel size starting with the default pixel size. This might reveal the close to best pixel size value for each map. For instance, see table 1 in this reference from Michael Rossmann: https://linkinghub.elsevier.com/retrieve/pii/S0092867402006608
However, I think this is more of applying a band-aid than really figuring out the source of the problem. Any advice from the cryosparc community is appreciated.
Is there a lot of residual beam tilt?
In my case there shouldn’t be - there was ~1.1mrad of beam tilt, but that was corrected for prior to 3D classification.
Unless 3D classification doesn’t take account of beam tilt? I know it can read aniso mag though, so I assume it can take care of beam tilt…?
Does beam tilt correction make up for magnification changes due to defocus with non-parallel beam?
(I also don’t know the formula off the top of my head, what magnitude of difference to expect).
1 Like
Ah probably not, I hadn’t thought of that, but I see you shared a relevant link previously:
I guess this could be the issue - seems like it could be problematic for large viruses etc. No way to refine per micrograph magnification though I think (at least in csparc)?
UPDATE:
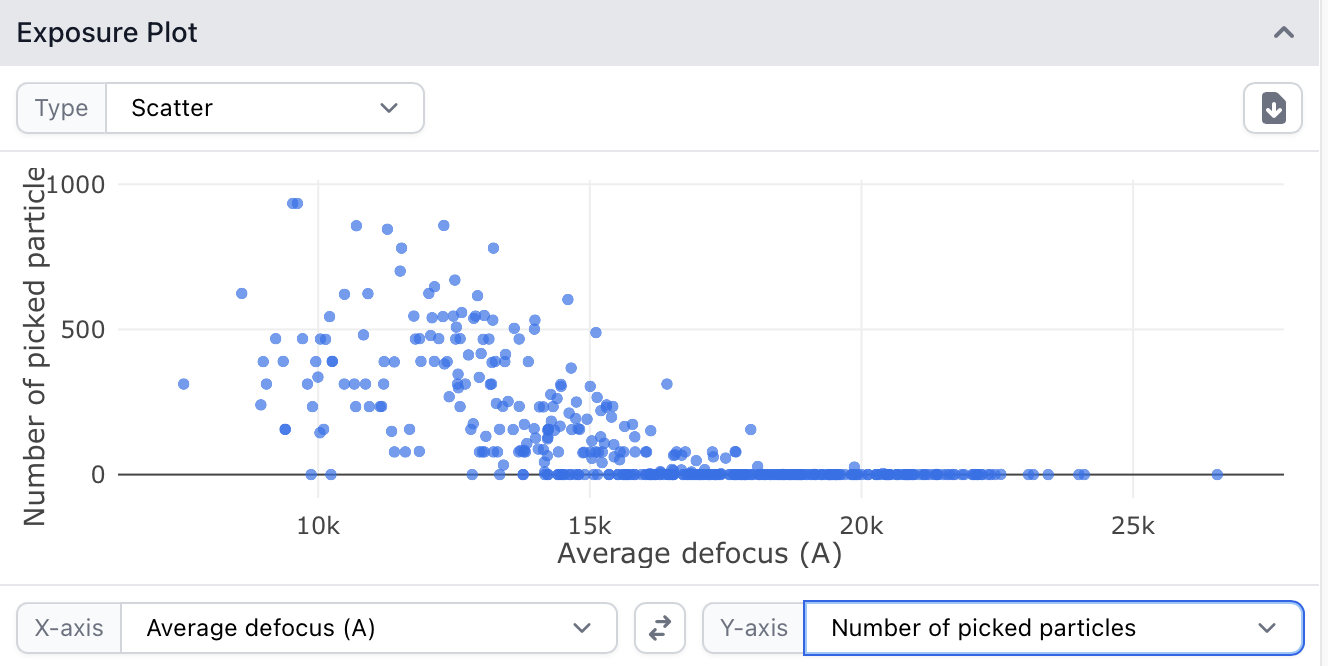
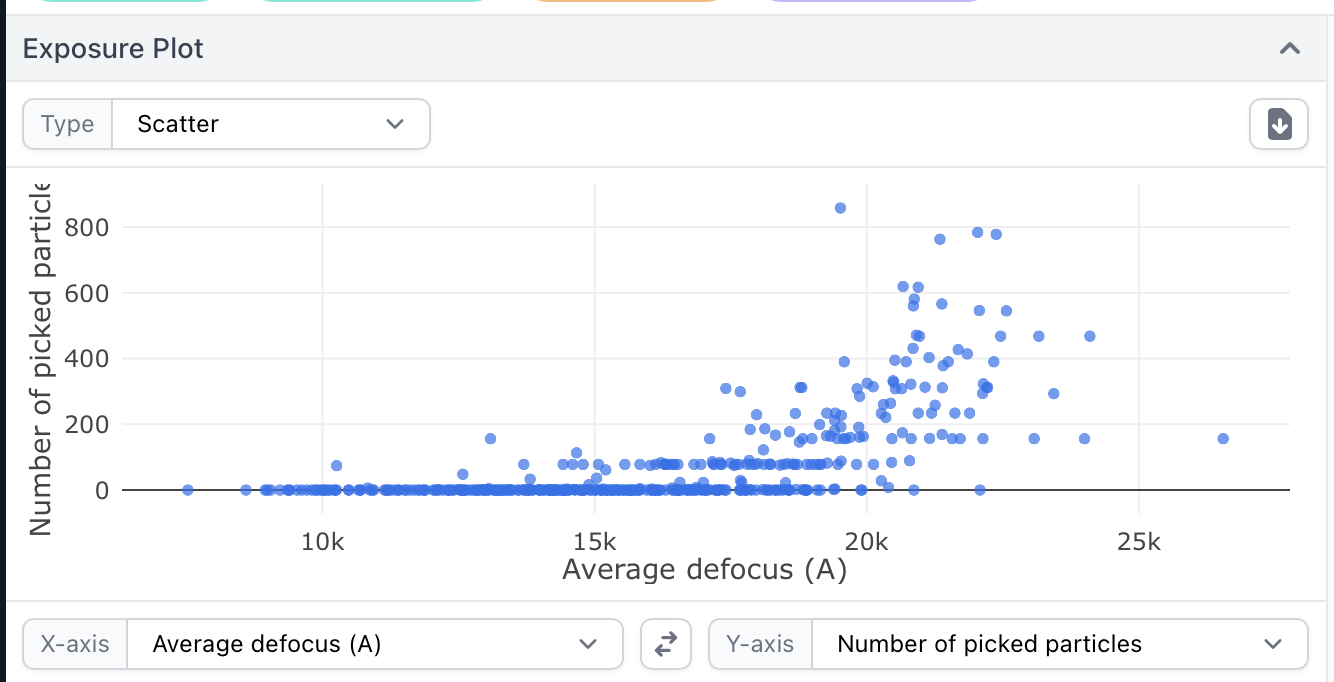
This indeed seems to be the case. If I take the “big” and “small” classes and plot defocus vs number of particles separately for each using curate exposures, one has particles from high defocus mics, the other has low defocus mics. Thanks @DanielAsarnow! I guess for very large particles, collecting with a relatively small defocus range might be desirable, to minimize this effect.
I wonder whether it might be possible to add the capacity to refine per particle magnification @team, to correct for this effect and allow for rescuing such datasets?
1 Like
Exactly! I forgot I had thought about this before and about that web page. The change is actually pretty significant - and the only way to correct it is with explicit magnification refinement.
The change in effective magnification is almost completely linear though, so I wonder if instead of regular magnification refinement with per-micrograph (or defocus based) exposure groups, the slope could be estimated and applied directly based on (local) defocus.
1 Like
Hi everyone,
Very interesting discussion here. Thanks for bringing this effect to our attention; we were not previously aware of it. How often are you seeing this effect? Do you know of any publicly available (e.g. EMPIAR) dataset that exhibits this phenomenon?
–Harris
Hi Harris, not sure if there is an EMPIAR dataset that shows it, but we can send you our data if helpful?
Thanks Oli, I’ll send you a direct message about this.
1 Like
It should be apparent in any data with ~1 mrad or more of (residual) tilt after sorting by defocus. Oli’s data with the known classes is a good idea though.
Possibly EMPIAR-10639, which has around 0.7 mrad, or EMPIAR-10186 which has several microns of uncompensated image shift, will also exhibit the effect.
1 Like
@olibclarke : I think there is a per-particle-magnification correction module in jspr. You are right in pointing to large viruses where this will be quite evident. But perhaps, if the data were collected on a patch of substantially thick ice, then even smaller non-virus complexes might have a “large” distribution?
@saifH the effect is due to a non-parallel beam causing magnification to vary with defocus, the ice thickness shouldn’t make a difference.
Thanks for the note about jspr. There’s per-particle magnification refinement in Frealign as well (not exposed through the cisTEM UI unfortunately). You can also make every micrograph or different defocus ranges into their own optics groups to get something appropriate out of Relion or cryoSPARC. I’m pretty sure there’s an analytic solution though, given refined beam tilts.
I had a similar problem. The illumination was parallel, but some other optical problem (perhaps the energy filter) caused different magnification. 3D classification without alignment picks up this difference in magnification and sorts the particles into classes with reconstructions of different size. The difference is in the order of 0.5%, which is significant for large complexes.
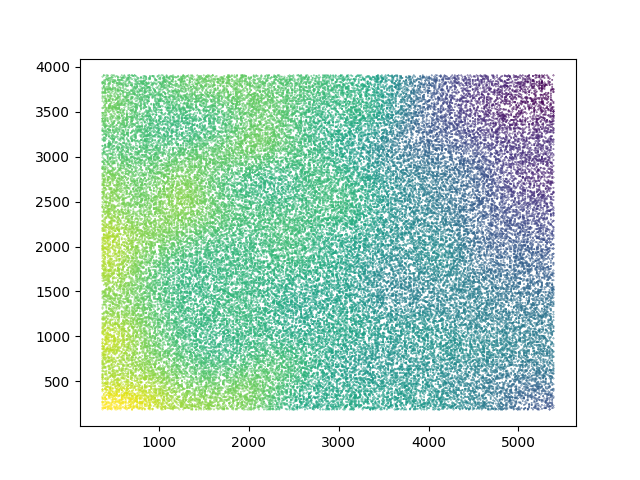
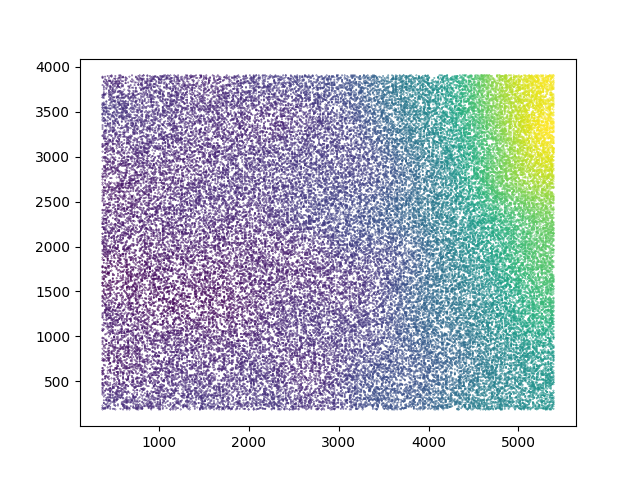
Plotting the X- and Y- coordinates on the detector of each of the particles in the different classes gives biased distributions for the left and right side of the detector!
It would be great to have per-particle magnification calibration in the homogeneous refinement job-type.
3 Likes
Interesting report! Can you clarify what the colour on those plots indicates – is it defocus, or something else?
It’s a heatmap (default matplotlib colorscale, yellow is higher density), showing that more particles originate from the left or right side of the detector in classes generating small or large reconstructions.
1 Like
@daniel.s.d.larsson Was this dataset collected exclusively on-axis? If not, what was the pattern of multiple records/shots per hole?
It was collected using AFIS and with 7 shots per hole. There are weak correlations with the shift distance/direction when grouping images into optics groups for each hole, but not enough to explain the size-differences in the reconstructions. The AFIS calibration was checked on this scope and the off-axis coma was within specs.
Was the hole edge more likely to be on one side of the detector with this targeting?