Deep Picker Inference: ValueError: need more than 1 value to unpack

Hi, I have the same issue with deep picker. The training finishes normally, but inference fails the way other users saw. I tried several datasets, two different lanes with different types of GPUs and am getting same errors. Below is one of the job logs:

================= CRYOSPARCW ======= 2022-07-19 16:53:24.477819 =========
Project P218 Job J58
Master cryosparc.host.utmb.edu Port 39002

========= monitor process now starting main process
MAINPROCESS PID 242447
========= monitor process now waiting for main process
MAIN PID 242447
deep_picker.run_deep_picker cryosparc_compute.jobs.jobregister
2022-07-19 16:53:26.442804: I tensorflow/stream_executor/platform/default/dso_loader.cc:49] Successfully o
pened dynamic library libcudart.so.11.0
========= sending heartbeat
2022-07-19 16:53:36.845068: I tensorflow/compiler/jit/xla_cpu_device.cc:41] Not creating XLA devices, tf_x
la_enable_xla_devices not set
2022-07-19 16:53:36.848634: I tensorflow/stream_executor/platform/default/dso_loader.cc:49] Successfully o
pened dynamic library libcuda.so.1
2022-07-19 16:53:36.870129: I tensorflow/core/common_runtime/gpu/gpu_device.cc:1720] Found device 0 with p
roperties:
pciBusID: 0000:18:00.0 name: NVIDIA GeForce RTX 2080 Ti computeCapability: 7.5
coreClock: 1.545GHz coreCount: 68 deviceMemorySize: 10.76GiB deviceMemoryBandwidth: 573.69GiB/s
2022-07-19 16:53:36.870569: I tensorflow/core/common_runtime/gpu/gpu_device.cc:1720] Found device 1 with p
roperties:
pciBusID: 0000:3b:00.0 name: NVIDIA GeForce RTX 2080 Ti computeCapability: 7.5
coreClock: 1.545GHz coreCount: 68 deviceMemorySize: 10.76GiB deviceMemoryBandwidth: 573.69GiB/s
2022-07-19 16:53:36.870954: I tensorflow/core/common_runtime/gpu/gpu_device.cc:1720] Found device 2 with p
roperties:
pciBusID: 0000:86:00.0 name: NVIDIA GeForce RTX 2080 Ti computeCapability: 7.5
coreClock: 1.545GHz coreCount: 68 deviceMemorySize: 10.76GiB deviceMemoryBandwidth: 573.69GiB/s
2022-07-19 16:53:36.871349: I tensorflow/core/common_runtime/gpu/gpu_device.cc:1720] Found device 3 with p
roperties:
pciBusID: 0000:af:00.0 name: NVIDIA GeForce RTX 2080 Ti computeCapability: 7.5
coreClock: 1.545GHz coreCount: 68 deviceMemorySize: 10.76GiB deviceMemoryBandwidth: 573.69GiB/s
2022-07-19 16:53:36.871388: I tensorflow/stream_executor/platform/default/dso_loader.cc:49] Successfully o
pened dynamic library libcudart.so.11.0
2022-07-19 16:53:36.882954: I tensorflow/stream_executor/platform/default/dso_loader.cc:49] Successfully o
pened dynamic library libcublas.so.11
2022-07-19 16:53:36.883058: I tensorflow/stream_executor/platform/default/dso_loader.cc:49] Successfully o
pened dynamic library libcublasLt.so.11
2022-07-19 16:53:36.886501: I tensorflow/stream_executor/platform/default/dso_loader.cc:49] Successfully o
pened dynamic library libcufft.so.10
2022-07-19 16:53:36.888658: I tensorflow/stream_executor/platform/default/dso_loader.cc:49] Successfully o
pened dynamic library libcurand.so.10
2022-07-19 16:53:36.891538: I tensorflow/stream_executor/platform/default/dso_loader.cc:49] Successfully o
pened dynamic library libcusolver.so.10
2022-07-19 16:53:36.894541: I tensorflow/stream_executor/platform/default/dso_loader.cc:49] Successfully o
pened dynamic library libcusparse.so.11
2022-07-19 16:53:36.896552: I tensorflow/stream_executor/platform/default/dso_loader.cc:49] Successfully o
pened dynamic library libcudnn.so.8
2022-07-19 16:53:36.899540: I tensorflow/core/common_runtime/gpu/gpu_device.cc:1862] Adding visible gpu de
vices: 0, 1, 2, 3
2022-07-19 16:53:36.900535: I tensorflow/core/platform/cpu_feature_guard.cc:142] This TensorFlow binary is
optimized with oneAPI Deep Neural Network Library (oneDNN) to use the following CPU instructions in perfo
rmance-critical operations: AVX2 AVX512F FMA
To enable them in other operations, rebuild TensorFlow with the appropriate compiler flags.
2022-07-19 16:53:36.903344: I tensorflow/compiler/jit/xla_gpu_device.cc:99] Not creating XLA devices, tf_x
la_enable_xla_devices not set
2022-07-19 16:53:36.903935: I tensorflow/core/common_runtime/gpu/gpu_device.cc:1720] Found device 0 with p
roperties:
pciBusID: 0000:18:00.0 name: NVIDIA GeForce RTX 2080 Ti computeCapability: 7.5
coreClock: 1.545GHz coreCount: 68 deviceMemorySize: 10.76GiB deviceMemoryBandwidth: 573.69GiB/s
2022-07-19 16:53:36.903986: I tensorflow/stream_executor/platform/default/dso_loader.cc:49] Successfully o
pened dynamic library libcudart.so.11.0
2022-07-19 16:53:36.904015: I tensorflow/stream_executor/platform/default/dso_loader.cc:49] Successfully o
pened dynamic library libcublas.so.11
2022-07-19 16:53:36.904031: I tensorflow/stream_executor/platform/default/dso_loader.cc:49] Successfully o
pened dynamic library libcublasLt.so.11
2022-07-19 16:53:36.904046: I tensorflow/stream_executor/platform/default/dso_loader.cc:49] Successfully o
pened dynamic library libcufft.so.10
2022-07-19 16:53:36.904061: I tensorflow/stream_executor/platform/default/dso_loader.cc:49] Successfully o
pened dynamic library libcurand.so.10
2022-07-19 16:53:36.904076: I tensorflow/stream_executor/platform/default/dso_loader.cc:49] Successfully o
pened dynamic library libcusolver.so.10
2022-07-19 16:53:36.904091: I tensorflow/stream_executor/platform/default/dso_loader.cc:49] Successfully o
pened dynamic library libcusparse.so.11
2022-07-19 16:53:36.904106: I tensorflow/stream_executor/platform/default/dso_loader.cc:49] Successfully o
pened dynamic library libcudnn.so.8
2022-07-19 16:53:36.904833: I tensorflow/core/common_runtime/gpu/gpu_device.cc:1862] Adding visible gpu de
vices: 0
2022-07-19 16:53:36.904870: I tensorflow/stream_executor/platform/default/dso_loader.cc:49] Successfully o
pened dynamic library libcudart.so.11.0
2022-07-19 16:53:37.683131: I tensorflow/core/common_runtime/gpu/gpu_device.cc:1261] Device interconnect S
treamExecutor with strength 1 edge matrix:
2022-07-19 16:53:37.683194: I tensorflow/core/common_runtime/gpu/gpu_device.cc:1267] 0
2022-07-19 16:53:37.683209: I tensorflow/core/common_runtime/gpu/gpu_device.cc:1280] 0: N
2022-07-19 16:53:37.684870: I tensorflow/core/common_runtime/gpu/gpu_device.cc:1406] Created TensorFlow de
vice (/job:localhost/replica:0/task:0/device:GPU:0 with 128 MB memory) → physical GPU (device: 0, name: N
VIDIA GeForce RTX 2080 Ti, pci bus id: 0000:18:00.0, compute capability: 7.5)
WARNING:tensorflow:Error in loading the saved optimizer state. As a result, your model is starting with a
freshly initialized optimizer.
========= sending heartbeat
2022-07-19 16:53:46.646396: I tensorflow/compiler/mlir/mlir_graph_optimization_pass.cc:116] None of the ML
IR optimization passes are enabled (registered 2)
2022-07-19 16:53:46.647119: I tensorflow/core/platform/profile_utils/cpu_utils.cc:112] CPU Frequency: 2200
000000 Hz
2022-07-19 16:53:48.217213: I tensorflow/stream_executor/platform/default/dso_loader.cc:49] Successfully o
pened dynamic library libcudnn.so.8
2022-07-19 16:53:50.627088: W tensorflow/core/common_runtime/bfc_allocator.cc:248] Allocator (GPU_0_bfc) r
an out of memory trying to allocate 302.29MiB with freed_by_count=0. The caller indicates that this is not
a failure, but may mean that there could be performance gains if more memory were available.
2022-07-19 16:53:50.627287: W tensorflow/core/common_runtime/bfc_allocator.cc:248] Allocator (GPU_0_bfc) r
an out of memory trying to allocate 302.29MiB with freed_by_count=0. The caller indicates that this is not
a failure, but may mean that there could be performance gains if more memory were available.
2022-07-19 16:53:50.627825: I tensorflow/stream_executor/platform/default/dso_loader.cc:49] Successfully o
pened dynamic library libcublas.so.11
2022-07-19 16:53:51.580539: I tensorflow/stream_executor/platform/default/dso_loader.cc:49] Successfully o
pened dynamic library libcublasLt.so.11
2022-07-19 16:53:51.585989: W tensorflow/core/common_runtime/bfc_allocator.cc:248] Allocator (GPU_0_bfc) r
an out of memory trying to allocate 548.13MiB with freed_by_count=0. The caller indicates that this is not
a failure, but may mean that there could be performance gains if more memory were available.
2022-07-19 16:53:51.586063: W tensorflow/core/common_runtime/bfc_allocator.cc:248] Allocator (GPU_0_bfc) r
an out of memory trying to allocate 548.13MiB with freed_by_count=0. The caller indicates that this is not
a failure, but may mean that there could be performance gains if more memory were available.
2022-07-19 16:53:51.590803: W tensorflow/core/common_runtime/bfc_allocator.cc:248] Allocator (GPU_0_bfc) r
an out of memory trying to allocate 88.00MiB with freed_by_count=0. The caller indicates that this is not
a failure, but may mean that there could be performance gains if more memory were available.
2022-07-19 16:53:51.590875: W tensorflow/core/common_runtime/bfc_allocator.cc:248] Allocator (GPU_0_bfc) r
an out of memory trying to allocate 88.00MiB with freed_by_count=0. The caller indicates that this is not
a failure, but may mean that there could be performance gains if more memory were available.
2022-07-19 16:53:51.596573: W tensorflow/core/common_runtime/bfc_allocator.cc:248] Allocator (GPU_0_bfc) r
an out of memory trying to allocate 592.14MiB with freed_by_count=0. The caller indicates that this is not
a failure, but may mean that there could be performance gains if more memory were available.
2022-07-19 16:53:51.596639: W tensorflow/core/common_runtime/bfc_allocator.cc:248] Allocator (GPU_0_bfc) r
an out of memory trying to allocate 592.14MiB with freed_by_count=0. The caller indicates that this is not
a failure, but may mean that there could be performance gains if more memory were available.
2022-07-19 16:53:51.615351: W tensorflow/core/common_runtime/bfc_allocator.cc:248] Allocator (GPU_0_bfc) r
an out of memory trying to allocate 548.16MiB with freed_by_count=0. The caller indicates that this is not
a failure, but may mean that there could be performance gains if more memory were available.
2022-07-19 16:53:51.615425: W tensorflow/core/common_runtime/bfc_allocator.cc:248] Allocator (GPU_0_bfc) r
an out of memory trying to allocate 548.16MiB with freed_by_count=0. The caller indicates that this is not
a failure, but may mean that there could be performance gains if more memory were available.


Running job on hostname %s gimli.utmb.edu
Allocated Resources : {‘fixed’: {‘SSD’: False}, ‘hostname’: ‘gimli.utmb.edu’, ‘lane’: ‘smith’, 'lane_type
': ‘smith’, ‘license’: True, ‘licenses_acquired’: 1, ‘slots’: {‘CPU’: [0], ‘GPU’: [0], ‘RAM’: [0]}, ‘targe
t’: {‘cache_path’: ‘/mnt/scratch/cryosparc_cache’, ‘cache_quota_mb’: None, ‘cache_reserve_mb’: 10000, ‘des
c’: None, ‘gpus’: [{‘id’: 0, ‘mem’: 11554848768, ‘name’: ‘NVIDIA GeForce RTX 2080 Ti’}, {‘id’: 1, ‘mem’: 1
1554848768, ‘name’: ‘NVIDIA GeForce RTX 2080 Ti’}, {‘id’: 2, ‘mem’: 11554848768, ‘name’: ‘NVIDIA GeForce R
TX 2080 Ti’}, {‘id’: 3, ‘mem’: 11554848768, ‘name’: ‘NVIDIA GeForce RTX 2080 Ti’}], ‘hostname’: ‘gimli.utm
b.edu’, ‘lane’: ‘smith’, ‘monitor_port’: None, ‘name’: ‘gimli.utmb.edu’, ‘resource_fixed’: {‘SSD’: True},
‘resource_slots’: {‘CPU’: [0, 1, 2, 3, 4, 5, 6, 7, 8, 9, 10, 11, 12, 13, 14, 15, 16, 17, 18, 19, 20, 21, 2
2, 23, 24, 25, 26, 27, 28, 29, 30, 31, 32, 33, 34, 35, 36, 37, 38, 39], ‘GPU’: [0, 1, 2, 3], ‘RAM’: [0, 1,
2, 3, 4, 5, 6, 7, 8, 9, 10, 11, 12, 13, 14, 15, 16, 17, 18, 19, 20, 21, 22, 23, 24, 25, 26, 27, 28, 29, 3
0, 31, 32, 33, 34, 35, 36, 37, 38, 39, 40, 41, 42, 43, 44, 45, 46, 47]}, ‘ssh_str’: ‘cryosparc@gimli.utmb.
edu’, ‘title’: ‘Worker node gimli.utmb.edu’, ‘type’: ‘node’, ‘worker_bin_path’: ‘/mnt/ape2/cryosparc/softw
are/cryosparc/cryosparc_worker/bin/cryosparcw’}}
**** handle exception rc
set status to failed

Tried to split input micrographs, still get the same error:
Launching job on lane default target cryosparc.host.utmb.edu …

Running job on master node hostname cryosparc.host.utmb.edu

[CPU: 69.2 MB] Project P218 Job J58 Started

[CPU: 69.3 MB] Master running v3.3.2+220518, worker running v3.3.2+220518

[CPU: 69.5 MB] Working in directory: /mnt/gimli/data2/P218/J58

[CPU: 69.5 MB] Running on lane default

[CPU: 69.5 MB] Resources allocated:

[CPU: 69.5 MB] Worker: cryosparc.host.utmb.edu

[CPU: 69.5 MB] CPU : [0]

[CPU: 69.5 MB] GPU : [0]

[CPU: 69.5 MB] RAM : [0]

[CPU: 69.5 MB] SSD : False

[CPU: 69.5 MB] --------------------------------------------------------------

[CPU: 69.5 MB] Importing job module for job type deep_picker_inference…

[CPU: 364.5 MB] Job ready to run

[CPU: 364.5 MB] ***************************************************************

[CPU: 368.5 MB] Using TensorFlow version 2.4.1

[CPU: 368.5 MB] Processing micrographs and inferring particles…

[CPU: 368.5 MB] Loading model…

[CPU: 368.5 MB] Loaded model.

[CPU: 368.5 MB] 0/500 micrographs processed.

[CPU: 1.97 GB] Original micrograph:
[CPU: 1.78 GB] Traceback (most recent call last):
File “cryosparc_worker/cryosparc_compute/run.py”, line 85, in cryosparc_compute.run.main
File “cryosparc_worker/cryosparc_compute/jobs/deep_picker/run_deep_picker.py”, line 535, in cryosparc_compute.jobs.deep_picker.run_deep_picker.run_deep_picker_inference
File “cryosparc_worker/cryosparc_compute/jobs/deep_picker/deep_picker_utils.py”, line 875, in cryosparc_compute.jobs.deep_picker.deep_picker_utils.picker_extract_worker
File “cryosparc_worker/cryosparc_compute/jobs/deep_picker/deep_picker_utils.py”, line 880, in cryosparc_compute.jobs.deep_picker.deep_picker_utils.picker_extract_worker
File “cryosparc_worker/cryosparc_compute/jobs/deep_picker/deep_picker_utils.py”, line 792, in cryosparc_compute.jobs.deep_picker.deep_picker_utils.picker_extract_worker._do_picking
File “/mnt/ape2/cryosparc/software/cryosparc/cryosparc_worker/cryosparc_compute/micrograph_plotutils.py”, line 45, in showarray
a = a.reshape(-1, a.shape[-2], a.shape[-1])
ValueError: cannot reshape array of size 0 into shape (0,1)

This particular error comes up with “show plots” turned on, without that I get “ValueError: need more than 1 value to unpack” error.

Another user can run successfully inference job on the same default lane. I am not sure what is the difference.
Thanks, Michael

If you and that other user agree, we would like to compare between the failed and successful Inference jobs:

  • Inference pixel threshold
  • the non-default parameters from the upstream Deep Picker Train jobs
  • the number of particles input to the upstream Deep Picker Train jobs
  • the format and pixel dimensions of the micrographs
1 Like

Hi @wtempel, I used 5 pixel threshold and tried larger values, like 204000, same result. micrographs in both cases were in mrc format, 4096x4096; went through motion correction, CTF determination, etc., all standard workflow. I tried inference job with different number of particles, ranging from ~200 to ~100,000 (coming from 2D classification job). The smaller number of particles came directly from manual picking job.
in Deep Picker Train job nonstandard parameters were: 1. Number of micrographs to process = 100; 2. Particle diameter = 500 A. The rest was set to default values.
For the other user, he used number of threads = 1; also Number of micrographs to process = 500; and same particle diameter of 500 A. Inference threshold was 5 in his case. Number of particles was 6110. Same mrc micrographs that went through same sequence of jobs. In his case images were taken with K3 camera, so the shape was 4092x5760.
I could share a couple of micrographs if needed.
Thanks,
Michael

Hello @mbs , did you find the error in the end? I am having the same issue right now.

Hi @MmM, sorry not so far. There should be something in user settings since another user here was able to run it but I am not.

Hello @mbs , sorry to hear that. None of the suggestions on the forum helped me so far. I am also missing some of the settings from the menu (see the picture). First, there were some issues with the training itself that we solved based on this discussion.. I am wondering if the errors are related.
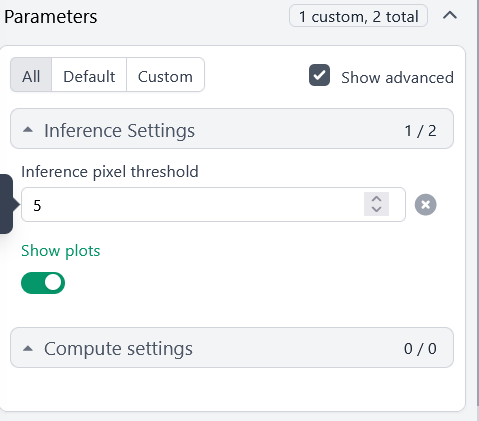
image
Note: I also tried it without the plots.

Hi, I have the same problem. Other pickers (including Topaz) work fine. I have included screenshots with details about the exposures and the Deep Picker Train/Inference jobs.


Hi, I have exactly the same problem.

@Boszlacs @gha Please inspect the failed jobs’ job.log files for additional error messages. If there is an error about a missing libcusolver.so.10, you may try the suggestion in DeepPicker error: Input number of GPUs must be less than or equal to number of available GPUs - #33 by nikydna.

Hi,

Thanks for your reply!
I checked the job.log file and cannot find that error. There are some memory warnings at the end though:

================= CRYOSPARCW =======  2023-03-21 10:37:51.918938  =========
Project P35 Job J34
Master hulk Port 39002
===========================================================================
========= monitor process now starting main process at 2023-03-21 10:37:51.918970
MAINPROCESS PID 1008998
========= monitor process now waiting for main process
MAIN PID 1008998
deep_picker.run_deep_picker cryosparc_compute.jobs.jobregister
2023-03-21 10:37:55.205472: I tensorflow/stream_executor/platform/default/dso_loader.cc:49] Successfully opened dynamic library libcudart.so.11.0
2023-03-21 10:37:58.744436: I tensorflow/compiler/jit/xla_cpu_device.cc:41] Not creating XLA devices, tf_xla_enable_xla_devices not set
2023-03-21 10:37:58.745804: I tensorflow/stream_executor/platform/default/dso_loader.cc:49] Successfully opened dynamic library libcuda.so.1
2023-03-21 10:37:58.812148: I tensorflow/core/common_runtime/gpu/gpu_device.cc:1720] Found device 0 with properties: 
pciBusID: 0000:01:00.0 name: NVIDIA GeForce RTX 3090 computeCapability: 8.6
coreClock: 1.695GHz coreCount: 82 deviceMemorySize: 23.70GiB deviceMemoryBandwidth: 871.81GiB/s
2023-03-21 10:37:58.813368: I tensorflow/core/common_runtime/gpu/gpu_device.cc:1720] Found device 1 with properties: 
pciBusID: 0000:25:00.0 name: NVIDIA GeForce RTX 3090 computeCapability: 8.6
coreClock: 1.695GHz coreCount: 82 deviceMemorySize: 23.70GiB deviceMemoryBandwidth: 871.81GiB/s
2023-03-21 10:37:58.814568: I tensorflow/core/common_runtime/gpu/gpu_device.cc:1720] Found device 2 with properties: 
pciBusID: 0000:c1:00.0 name: NVIDIA GeForce RTX 3090 computeCapability: 8.6
coreClock: 1.695GHz coreCount: 82 deviceMemorySize: 23.70GiB deviceMemoryBandwidth: 871.81GiB/s
2023-03-21 10:37:58.815772: I tensorflow/core/common_runtime/gpu/gpu_device.cc:1720] Found device 3 with properties: 
pciBusID: 0000:e1:00.0 name: NVIDIA GeForce RTX 3090 computeCapability: 8.6
coreClock: 1.695GHz coreCount: 82 deviceMemorySize: 23.70GiB deviceMemoryBandwidth: 871.81GiB/s
2023-03-21 10:37:58.815792: I tensorflow/stream_executor/platform/default/dso_loader.cc:49] Successfully opened dynamic library libcudart.so.11.0
2023-03-21 10:37:58.818758: I tensorflow/stream_executor/platform/default/dso_loader.cc:49] Successfully opened dynamic library libcublas.so.11
2023-03-21 10:37:58.818802: I tensorflow/stream_executor/platform/default/dso_loader.cc:49] Successfully opened dynamic library libcublasLt.so.11
2023-03-21 10:37:58.820567: I tensorflow/stream_executor/platform/default/dso_loader.cc:49] Successfully opened dynamic library libcufft.so.10
2023-03-21 10:37:58.820777: I tensorflow/stream_executor/platform/default/dso_loader.cc:49] Successfully opened dynamic library libcurand.so.10
2023-03-21 10:37:58.822218: I tensorflow/stream_executor/platform/default/dso_loader.cc:49] Successfully opened dynamic library libcusolver.so.10
2023-03-21 10:37:58.822942: I tensorflow/stream_executor/platform/default/dso_loader.cc:49] Successfully opened dynamic library libcusparse.so.11
2023-03-21 10:37:58.823063: I tensorflow/stream_executor/platform/default/dso_loader.cc:49] Successfully opened dynamic library libcudnn.so.8
2023-03-21 10:37:58.832745: I tensorflow/core/common_runtime/gpu/gpu_device.cc:1862] Adding visible gpu devices: 0, 1, 2, 3
2023-03-21 10:37:58.833281: I tensorflow/core/platform/cpu_feature_guard.cc:142] This TensorFlow binary is optimized with oneAPI Deep Neural Network Library (oneDNN) to use the following CPU instructions in performance-critical operations:  AVX2 FMA
To enable them in other operations, rebuild TensorFlow with the appropriate compiler flags.
2023-03-21 10:37:58.840840: I tensorflow/compiler/jit/xla_gpu_device.cc:99] Not creating XLA devices, tf_xla_enable_xla_devices not set
2023-03-21 10:37:58.842174: I tensorflow/core/common_runtime/gpu/gpu_device.cc:1720] Found device 0 with properties: 
pciBusID: 0000:01:00.0 name: NVIDIA GeForce RTX 3090 computeCapability: 8.6
coreClock: 1.695GHz coreCount: 82 deviceMemorySize: 23.70GiB deviceMemoryBandwidth: 871.81GiB/s
2023-03-21 10:37:58.842204: I tensorflow/stream_executor/platform/default/dso_loader.cc:49] Successfully opened dynamic library libcudart.so.11.0
2023-03-21 10:37:58.842236: I tensorflow/stream_executor/platform/default/dso_loader.cc:49] Successfully opened dynamic library libcublas.so.11
2023-03-21 10:37:58.842249: I tensorflow/stream_executor/platform/default/dso_loader.cc:49] Successfully opened dynamic library libcublasLt.so.11
2023-03-21 10:37:58.842262: I tensorflow/stream_executor/platform/default/dso_loader.cc:49] Successfully opened dynamic library libcufft.so.10
2023-03-21 10:37:58.842274: I tensorflow/stream_executor/platform/default/dso_loader.cc:49] Successfully opened dynamic library libcurand.so.10
2023-03-21 10:37:58.842286: I tensorflow/stream_executor/platform/default/dso_loader.cc:49] Successfully opened dynamic library libcusolver.so.10
2023-03-21 10:37:58.842298: I tensorflow/stream_executor/platform/default/dso_loader.cc:49] Successfully opened dynamic library libcusparse.so.11
2023-03-21 10:37:58.842309: I tensorflow/stream_executor/platform/default/dso_loader.cc:49] Successfully opened dynamic library libcudnn.so.8
2023-03-21 10:37:58.844671: I tensorflow/core/common_runtime/gpu/gpu_device.cc:1862] Adding visible gpu devices: 0
2023-03-21 10:37:58.844708: I tensorflow/stream_executor/platform/default/dso_loader.cc:49] Successfully opened dynamic library libcudart.so.11.0
2023-03-21 10:37:59.304435: I tensorflow/core/common_runtime/gpu/gpu_device.cc:1261] Device interconnect StreamExecutor with strength 1 edge matrix:
2023-03-21 10:37:59.304499: I tensorflow/core/common_runtime/gpu/gpu_device.cc:1267]      0 
2023-03-21 10:37:59.304506: I tensorflow/core/common_runtime/gpu/gpu_device.cc:1280] 0:   N 
2023-03-21 10:37:59.308668: I tensorflow/core/common_runtime/gpu/gpu_device.cc:1406] Created TensorFlow device (/job:localhost/replica:0/task:0/device:GPU:0 with 128 MB memory) -> physical GPU (device: 0, name: NVIDIA GeForce RTX 3090, pci bus id: 0000:01:00.0, compute capability: 8.6)
WARNING:tensorflow:Error in loading the saved optimizer state. As a result, your model is starting with a freshly initialized optimizer.
2023-03-21 10:38:04.087770: I tensorflow/compiler/mlir/mlir_graph_optimization_pass.cc:116] None of the MLIR optimization passes are enabled (registered 2)
2023-03-21 10:38:04.107091: I tensorflow/core/platform/profile_utils/cpu_utils.cc:112] CPU Frequency: 2499920000 Hz
2023-03-21 10:38:04.974445: I tensorflow/stream_executor/platform/default/dso_loader.cc:49] Successfully opened dynamic library libcudnn.so.8
========= sending heartbeat at 2023-03-21 10:38:05.091907
2023-03-21 10:38:06.870181: W tensorflow/core/common_runtime/bfc_allocator.cc:248] Allocator (GPU_0_bfc) ran out of memory trying to allocate 302.29MiB with freed_by_count=0. The caller indicates that this is not a failure, but may mean that there could be performance gains if more memory were available.
2023-03-21 10:38:06.870266: W tensorflow/core/common_runtime/bfc_allocator.cc:248] Allocator (GPU_0_bfc) ran out of memory trying to allocate 302.29MiB with freed_by_count=0. The caller indicates that this is not a failure, but may mean that there could be performance gains if more memory were available.
2023-03-21 10:38:06.870568: I tensorflow/stream_executor/platform/default/dso_loader.cc:49] Successfully opened dynamic library libcublas.so.11
2023-03-21 10:38:07.551969: I tensorflow/stream_executor/platform/default/dso_loader.cc:49] Successfully opened dynamic library libcublasLt.so.11
2023-03-21 10:38:07.555270: W tensorflow/core/common_runtime/bfc_allocator.cc:248] Allocator (GPU_0_bfc) ran out of memory trying to allocate 548.13MiB with freed_by_count=0. The caller indicates that this is not a failure, but may mean that there could be performance gains if more memory were available.
2023-03-21 10:38:07.555307: W tensorflow/core/common_runtime/bfc_allocator.cc:248] Allocator (GPU_0_bfc) ran out of memory trying to allocate 548.13MiB with freed_by_count=0. The caller indicates that this is not a failure, but may mean that there could be performance gains if more memory were available.
2023-03-21 10:38:07.558189: W tensorflow/core/common_runtime/bfc_allocator.cc:248] Allocator (GPU_0_bfc) ran out of memory trying to allocate 88.00MiB with freed_by_count=0. The caller indicates that this is not a failure, but may mean that there could be performance gains if more memory were available.
2023-03-21 10:38:07.558229: W tensorflow/core/common_runtime/bfc_allocator.cc:248] Allocator (GPU_0_bfc) ran out of memory trying to allocate 88.00MiB with freed_by_count=0. The caller indicates that this is not a failure, but may mean that there could be performance gains if more memory were available.
2023-03-21 10:38:07.587943: W tensorflow/core/common_runtime/bfc_allocator.cc:248] Allocator (GPU_0_bfc) ran out of memory trying to allocate 592.14MiB with freed_by_count=0. The caller indicates that this is not a failure, but may mean that there could be performance gains if more memory were available.
2023-03-21 10:38:07.588032: W tensorflow/core/common_runtime/bfc_allocator.cc:248] Allocator (GPU_0_bfc) ran out of memory trying to allocate 592.14MiB with freed_by_count=0. The caller indicates that this is not a failure, but may mean that there could be performance gains if more memory were available.
2023-03-21 10:38:07.601447: W tensorflow/core/common_runtime/bfc_allocator.cc:248] Allocator (GPU_0_bfc) ran out of memory trying to allocate 548.16MiB with freed_by_count=0. The caller indicates that this is not a failure, but may mean that there could be performance gains if more memory were available.
2023-03-21 10:38:07.601483: W tensorflow/core/common_runtime/bfc_allocator.cc:248] Allocator (GPU_0_bfc) ran out of memory trying to allocate 548.16MiB with freed_by_count=0. The caller indicates that this is not a failure, but may mean that there could be performance gains if more memory were available.
***************************************************************
Running job on hostname %s 11.0.0.2
Allocated Resources :  {'fixed': {'SSD': False}, 'hostname': '11.0.0.2', 'lane': 'echo', 'lane_type': 'node', 'license': True, 'licenses_acquired': 1, 'slots': {'CPU': [0], 'GPU': [0], 'RAM': [0]}, 'target': {'cache_path': '/scratch/cryosparc_cache', 'cache_quota_mb': None, 'cache_reserve_mb': 10000, 'desc': None, 'gpus': [{'id': 0, 'mem': 25447170048, 'name': 'NVIDIA GeForce RTX 3090'}, {'id': 1, 'mem': 25447170048, 'name': 'NVIDIA GeForce RTX 3090'}, {'id': 2, 'mem': 25447170048, 'name': 'NVIDIA GeForce RTX 3090'}, {'id': 3, 'mem': 25447170048, 'name': 'NVIDIA GeForce RTX 3090'}], 'hostname': '11.0.0.2', 'lane': 'echo', 'monitor_port': None, 'name': '11.0.0.2', 'resource_fixed': {'SSD': True}, 'resource_slots': {'CPU': [0, 1, 2, 3, 4, 5, 6, 7, 8, 9, 10, 11, 12, 13, 14, 15, 16, 17, 18, 19, 20, 21, 22, 23, 24, 25, 26, 27, 28, 29, 30, 31, 32, 33, 34, 35, 36, 37, 38, 39, 40, 41, 42, 43, 44, 45, 46, 47, 48, 49, 50, 51, 52, 53, 54, 55, 56, 57, 58, 59, 60, 61, 62, 63, 64, 65, 66, 67, 68, 69, 70, 71, 72, 73, 74, 75, 76, 77, 78, 79, 80, 81, 82, 83, 84, 85, 86, 87, 88, 89, 90, 91, 92, 93, 94, 95, 96, 97, 98, 99, 100, 101, 102, 103, 104, 105, 106, 107, 108, 109, 110, 111, 112, 113, 114, 115, 116, 117, 118, 119, 120, 121, 122, 123, 124, 125, 126, 127], 'GPU': [0, 1, 2, 3], 'RAM': [0, 1, 2, 3, 4, 5, 6, 7, 8, 9, 10, 11, 12, 13, 14, 15, 16, 17, 18, 19, 20, 21, 22, 23, 24, 25, 26, 27, 28, 29, 30, 31, 32, 33, 34, 35, 36, 37, 38, 39, 40, 41, 42, 43, 44, 45, 46, 47, 48, 49, 50, 51, 52, 53, 54, 55, 56, 57, 58, 59, 60, 61, 62, 63]}, 'ssh_str': 'cryosparcuser@11.0.0.2', 'title': 'Worker node 11.0.0.2', 'type': 'node', 'worker_bin_path': '/home/cryosparcuser/cryosparc/cryosparc_worker/bin/cryosparcw'}}
**** handle exception rc
Traceback (most recent call last):
  File "cryosparc_master/cryosparc_compute/run.py", line 96, in cryosparc_compute.run.main
  File "cryosparc_master/cryosparc_compute/jobs/deep_picker/run_deep_picker.py", line 535, in cryosparc_compute.jobs.deep_picker.run_deep_picker.run_deep_picker_inference
  File "cryosparc_master/cryosparc_compute/jobs/deep_picker/deep_picker_utils.py", line 874, in cryosparc_compute.jobs.deep_picker.deep_picker_utils.picker_extract_worker
  File "cryosparc_master/cryosparc_compute/jobs/deep_picker/deep_picker_utils.py", line 879, in cryosparc_compute.jobs.deep_picker.deep_picker_utils.picker_extract_worker
  File "cryosparc_master/cryosparc_compute/jobs/deep_picker/deep_picker_utils.py", line 801, in cryosparc_compute.jobs.deep_picker.deep_picker_utils.picker_extract_worker._do_picking
  File "cryosparc_master/cryosparc_compute/jobs/deep_picker/deep_picker_utils.py", line 569, in cryosparc_compute.jobs.deep_picker.deep_picker_utils.get_dataset_from_particle_centers
ValueError: need more than 1 value to unpack
set status to failed
========= main process now complete at 2023-03-21 10:38:08.277377.
========= monitor process now complete at 2023-03-21 10:38:08.284964.

Did you try the suggestion in Deep Picker Inference V 4.0.0, ValueError: need more than 1 value to unpack - #4 by prash?

Hi @wtempel, I am not sure what @prash means by “using a lower patch size” in that suggestion?

@prash Would you like to elaborate on how you made this work?

@wtempel @gha @eMKiso Sorry for the delay. Looks like the term ‘patch size’ is now called ‘Shape of split micrographs’ in the recent version of CryoSPARC. I lower to down from 256 to 64 to make it work.

1 Like

I experience the same issue with the Deep Picker Inference:

[CPU: 214.6 MB Avail: 50.99 GB]
Importing job module for job type deep_picker_inference…
[CPU: 538.8 MB Avail: 50.81 GB]
Job ready to run
[CPU: 538.8 MB Avail: 50.81 GB]


[CPU: 540.3 MB Avail: 50.81 GB]
Using TensorFlow version 2.8.4
[CPU: 540.3 MB Avail: 50.81 GB]
Processing micrographs and inferring particles…
[CPU: 540.3 MB Avail: 50.81 GB]
Loading model…
[CPU: 540.3 MB Avail: 50.81 GB]
Loaded model.
[CPU: 540.3 MB Avail: 50.81 GB]
0/103 micrographs processed.
[CPU: 1.09 GB Avail: 50.37 GB]
Traceback (most recent call last):
File “cryosparc_master/cryosparc_compute/run.py”, line 95, in cryosparc_master.cryosparc_compute.run.main
File “cryosparc_master/cryosparc_compute/jobs/deep_picker/run_deep_picker.py”, line 531, in cryosparc_master.cryosparc_compute.jobs.deep_picker.run_deep_picker.run_deep_picker_inference
File “cryosparc_master/cryosparc_compute/jobs/deep_picker/deep_picker_utils.py”, line 830, in cryosparc_master.cryosparc_compute.jobs.deep_picker.deep_picker_utils.picker_extract_worker
File “cryosparc_master/cryosparc_compute/jobs/deep_picker/deep_picker_utils.py”, line 835, in cryosparc_master.cryosparc_compute.jobs.deep_picker.deep_picker_utils.picker_extract_worker
File “cryosparc_master/cryosparc_compute/jobs/deep_picker/deep_picker_utils.py”, line 755, in cryosparc_master.cryosparc_compute.jobs.deep_picker.deep_picker_utils.picker_extract_worker._do_picking
File “cryosparc_master/cryosparc_compute/jobs/deep_picker/deep_picker_utils.py”, line 521, in cryosparc_master.cryosparc_compute.jobs.deep_picker.deep_picker_utils.get_dataset_from_particle_centers
ValueError: need more than 1 value to unpack

Training works fine and the diagnostic plots look good/as expected from successful training.

The “shape of split micrographs” approach does not work but results (naturally) in a significant increase in running time. The issue appears to come up quite frequently and has so far not been solved, at least judging what I see in the forum. Can someone provide support/help please?

Welcome to the forum @D_E_N_N_I_S .

Please can you confirm that this workaround did not work, and if it did not work, post the value specified for Shape of split micrographs, as well as excerpts form the Event Log and the job log (Metadata|Log) for the corresponding job.

Thank you!

Sorry for the late reply, several things came up in between…

Below I more comprehensive error/problem description.

I have a set of about 100 micrographs, imported them, curated the exposures, picked manually about 500 particles from 10 micrographs.
Next, I connected the output of the Manual Particle Picker Job to a Deep Train Job (Micrographs and Particles).
The Training of the Deep Picker I have done with default parameters, except for the parameter named “Shape of split micrographs”, this parameter I have tested for either 256, 128, and 64.
The Deep Train Job finished without any errors or warnings and the training reached acceptable accuracy and resulted in expected diagnostic curves, see the following image.

Next, I moved on to the Deep Picker Inference Job, employing the model just trained. For this I inputted the curated exposures (100 micrographs, from the curated exposure job) and the model from the Deep Picker Train Job to the Deep Picker Inference Job. It is only then when I experienced the error so frequently reported in the forum, despite the different settings of the parameter “Shape of split micrographs” is the Deep Picker Train Job.

[CPU: 214.6 MB Avail: 50.99 GB]

Importing job module for job type deep_picker_inference…
[CPU: 538.8 MB Avail: 50.81 GB]

Job ready to run
[CPU: 538.8 MB Avail: 50.81 GB]


[CPU: 540.3 MB Avail: 50.81 GB]

Using TensorFlow version 2.8.4
[CPU: 540.3 MB Avail: 50.81 GB]

Processing micrographs and inferring particles…
[CPU: 540.3 MB Avail: 50.81 GB]

Loading model…
[CPU: 540.3 MB Avail: 50.81 GB]

Loaded model.
[CPU: 540.3 MB Avail: 50.81 GB]

0/103 micrographs processed.
[CPU: 1.09 GB Avail: 50.37 GB]

Traceback (most recent call last):
File “cryosparc_master/cryosparc_compute/run.py”, line 95, in cryosparc_master.cryosparc_compute.run.main
File “cryosparc_master/cryosparc_compute/jobs/deep_picker/run_deep_picker.py”, line 531, in cryosparc_master.cryosparc_compute.jobs.deep_picker.run_deep_picker.run_deep_picker_inference
File “cryosparc_master/cryosparc_compute/jobs/deep_picker/deep_picker_utils.py”, line 830, in cryosparc_master.cryosparc_compute.jobs.deep_picker.deep_picker_utils.picker_extract_worker
File “cryosparc_master/cryosparc_compute/jobs/deep_picker/deep_picker_utils.py”, line 835, in cryosparc_master.cryosparc_compute.jobs.deep_picker.deep_picker_utils.picker_extract_worker
File “cryosparc_master/cryosparc_compute/jobs/deep_picker/deep_picker_utils.py”, line 755, in cryosparc_master.cryosparc_compute.jobs.deep_picker.deep_picker_utils.picker_extract_worker._do_picking
File “cryosparc_master/cryosparc_compute/jobs/deep_picker/deep_picker_utils.py”, line 521, in cryosparc_master.cryosparc_compute.jobs.deep_picker.deep_picker_utils.get_dataset_from_particle_centers
ValueError: need more than 1 value to unpack

Output from metadata tab (log file):

================= CRYOSPARCW =======  2023-11-28 13:57:07.765953  =========
Project P100 Job J98
Master redacted
===========================================================================
========= monitor process now starting main process at 2023-11-28 13:57:07.765982
MAINPROCESS PID 3681204
MAIN PID 3681204
deep_picker.run_deep_picker cryosparc_compute.jobs.jobregister
========= monitor process now waiting for main process
2023-11-28 13:57:13.472433: I tensorflow/stream_executor/cuda/cuda_gpu_executor.cc:936] successful NUMA node read from SysFS had negative value (-1), but there must be at least one NUMA node, so returning NUMA node zero
2023-11-28 13:57:13.472600: I tensorflow/stream_executor/cuda/cuda_gpu_executor.cc:936] successful NUMA node read from SysFS had negative value (-1), but there must be at least one NUMA node, so returning NUMA node zero
2023-11-28 13:57:13.484277: I tensorflow/stream_executor/cuda/cuda_gpu_executor.cc:936] successful NUMA node read from SysFS had negative value (-1), but there must be at least one NUMA node, so returning NUMA node zero
2023-11-28 13:57:13.484461: I tensorflow/stream_executor/cuda/cuda_gpu_executor.cc:936] successful NUMA node read from SysFS had negative value (-1), but there must be at least one NUMA node, so returning NUMA node zero
2023-11-28 13:57:13.484587: I tensorflow/stream_executor/cuda/cuda_gpu_executor.cc:936] successful NUMA node read from SysFS had negative value (-1), but there must be at least one NUMA node, so returning NUMA node zero
2023-11-28 13:57:13.484774: I tensorflow/stream_executor/cuda/cuda_gpu_executor.cc:936] successful NUMA node read from SysFS had negative value (-1), but there must be at least one NUMA node, so returning NUMA node zero
2023-11-28 13:57:13.485124: I tensorflow/core/platform/cpu_feature_guard.cc:151] This TensorFlow binary is optimized with oneAPI Deep Neural Network Library (oneDNN) to use the following CPU instructions in performance-critical operations:  AVX2 FMA
To enable them in other operations, rebuild TensorFlow with the appropriate compiler flags.
2023-11-28 13:57:13.485766: I tensorflow/stream_executor/cuda/cuda_gpu_executor.cc:936] successful NUMA node read from SysFS had negative value (-1), but there must be at least one NUMA node, so returning NUMA node zero
2023-11-28 13:57:13.485924: I tensorflow/stream_executor/cuda/cuda_gpu_executor.cc:936] successful NUMA node read from SysFS had negative value (-1), but there must be at least one NUMA node, so returning NUMA node zero
2023-11-28 13:57:13.486045: I tensorflow/stream_executor/cuda/cuda_gpu_executor.cc:936] successful NUMA node read from SysFS had negative value (-1), but there must be at least one NUMA node, so returning NUMA node zero
2023-11-28 13:57:13.551624: I tensorflow/stream_executor/cuda/cuda_gpu_executor.cc:936] successful NUMA node read from SysFS had negative value (-1), but there must be at least one NUMA node, so returning NUMA node zero
2023-11-28 13:57:13.551816: I tensorflow/stream_executor/cuda/cuda_gpu_executor.cc:936] successful NUMA node read from SysFS had negative value (-1), but there must be at least one NUMA node, so returning NUMA node zero
2023-11-28 13:57:13.551938: I tensorflow/stream_executor/cuda/cuda_gpu_executor.cc:936] successful NUMA node read from SysFS had negative value (-1), but there must be at least one NUMA node, so returning NUMA node zero
2023-11-28 13:57:13.552039: I tensorflow/core/common_runtime/gpu/gpu_device.cc:1525] Created device /job:localhost/replica:0/task:0/device:GPU:0 with 128 MB memory:  -> device: 1, name: NVIDIA GeForce RTX 2070 SUPER, pci bus id: 0000:02:00.0, compute capability: 7.5
/Local/cryosparc/cryosparc2_worker_remote/cryosparc_compute/jobs/motioncorrection/mic_utils.py:95: NumbaDeprecationWarning: The 'nopython' keyword argument was not supplied to the 'numba.jit' decorator. The implicit default value for this argument is currently False, but it will be changed to True in Numba 0.59.0.
  @jit(nogil=True)
/Local/cryosparc/cryosparc2_worker_remote/cryosparc_compute/micrographs.py:563: NumbaDeprecationWarning: The 'nopython' keyword argument was not supplied to the 'numba.jit' decorator. The implicit default value for this argument is currently False, but it will be changed to True in Numba 0.59.0.
  def contrast_normalization(arr_bin, tile_size = 128):
WARNING:tensorflow:Error in loading the saved optimizer state. As a result, your model is starting with a freshly initialized optimizer.
2023-11-28 13:57:18.427791: I tensorflow/stream_executor/cuda/cuda_dnn.cc:368] Loaded cuDNN version 8700
========= sending heartbeat at 2023-11-28 13:57:20.660539
2023-11-28 13:57:23.562697: W tensorflow/core/common_runtime/bfc_allocator.cc:275] Allocator (GPU_0_bfc) ran out of memory trying to allocate 302.29MiB with freed_by_count=0. The caller indicates that this is not a failure, but may mean that there could be performance gains if more memory were available.
2023-11-28 13:57:23.562744: W tensorflow/core/common_runtime/bfc_allocator.cc:275] Allocator (GPU_0_bfc) ran out of memory trying to allocate 302.29MiB with freed_by_count=0. The caller indicates that this is not a failure, but may mean that there could be performance gains if more memory were available.
2023-11-28 13:57:23.623509: W tensorflow/core/common_runtime/bfc_allocator.cc:275] Allocator (GPU_0_bfc) ran out of memory trying to allocate 548.13MiB with freed_by_count=0. The caller indicates that this is not a failure, but may mean that there could be performance gains if more memory were available.
2023-11-28 13:57:23.623556: W tensorflow/core/common_runtime/bfc_allocator.cc:275] Allocator (GPU_0_bfc) ran out of memory trying to allocate 548.13MiB with freed_by_count=0. The caller indicates that this is not a failure, but may mean that there could be performance gains if more memory were available.
2023-11-28 13:57:23.635687: W tensorflow/core/common_runtime/bfc_allocator.cc:275] Allocator (GPU_0_bfc) ran out of memory trying to allocate 88.00MiB with freed_by_count=0. The caller indicates that this is not a failure, but may mean that there could be performance gains if more memory were available.
2023-11-28 13:57:23.635723: W tensorflow/core/common_runtime/bfc_allocator.cc:275] Allocator (GPU_0_bfc) ran out of memory trying to allocate 88.00MiB with freed_by_count=0. The caller indicates that this is not a failure, but may mean that there could be performance gains if more memory were available.
2023-11-28 13:57:23.643030: W tensorflow/core/common_runtime/bfc_allocator.cc:275] Allocator (GPU_0_bfc) ran out of memory trying to allocate 592.14MiB with freed_by_count=0. The caller indicates that this is not a failure, but may mean that there could be performance gains if more memory were available.
2023-11-28 13:57:23.643065: W tensorflow/core/common_runtime/bfc_allocator.cc:275] Allocator (GPU_0_bfc) ran out of memory trying to allocate 592.14MiB with freed_by_count=0. The caller indicates that this is not a failure, but may mean that there could be performance gains if more memory were available.
2023-11-28 13:57:23.663594: W tensorflow/core/common_runtime/bfc_allocator.cc:275] Allocator (GPU_0_bfc) ran out of memory trying to allocate 548.16MiB with freed_by_count=0. The caller indicates that this is not a failure, but may mean that there could be performance gains if more memory were available.
2023-11-28 13:57:23.663628: W tensorflow/core/common_runtime/bfc_allocator.cc:275] Allocator (GPU_0_bfc) ran out of memory trying to allocate 548.16MiB with freed_by_count=0. The caller indicates that this is not a failure, but may mean that there could be performance gains if more memory were available.
***************************************************************
Running job on hostname redacted
Allocated Resources :  {'fixed': {'SSD': False}, 'hostname': 'redacted, 'lane': 'ERC3051', 'lane_type': 'node', 'license': True, 'licenses_acquired': 1, 'slots': {'CPU': [], 'GPU': [1], 'RAM': [1]}, 'target': {'cache_path': '/Local/cryosparc/cryosparc_scratch/', 'cache_quota_mb': None, 'cache_reserve_mb': 10000, 'desc': None, 'gpus': [{'id': 0, 'mem': 8359378944, 'name': 'NVIDIA GeForce RTX 2070 SUPER'}, {'id': 1, 'mem': 8361738240, 'name': 'NVIDIA GeForce RTX 2070 SUPER'}], 'hostname': 'redacted', 'lane': 'ERC3051', 'monitor_port': None, 'name': 'redacted', 'resource_fixed': {'SSD': True}, 'resource_slots': {'CPU': [0, 1, 2, 3, 4, 5, 6, 7], 'GPU': [0, 1], 'RAM': [0, 1, 2, 3, 4, 5, 6, 7]}, 'ssh_str': 'redacted', 'title': 'redacted', 'type': 'node', 'worker_bin_path': '/Local/cryosparc/cryosparc2_worker_remote/bin/cryosparcw'}}
**** handle exception rc
Traceback (most recent call last):
  File "cryosparc_master/cryosparc_compute/run.py", line 95, in cryosparc_master.cryosparc_compute.run.main
  File "cryosparc_master/cryosparc_compute/jobs/deep_picker/run_deep_picker.py", line 531, in cryosparc_master.cryosparc_compute.jobs.deep_picker.run_deep_picker.run_deep_picker_inference
  File "cryosparc_master/cryosparc_compute/jobs/deep_picker/deep_picker_utils.py", line 830, in cryosparc_master.cryosparc_compute.jobs.deep_picker.deep_picker_utils.picker_extract_worker
  File "cryosparc_master/cryosparc_compute/jobs/deep_picker/deep_picker_utils.py", line 835, in cryosparc_master.cryosparc_compute.jobs.deep_picker.deep_picker_utils.picker_extract_worker
  File "cryosparc_master/cryosparc_compute/jobs/deep_picker/deep_picker_utils.py", line 755, in cryosparc_master.cryosparc_compute.jobs.deep_picker.deep_picker_utils.picker_extract_worker._do_picking
  File "cryosparc_master/cryosparc_compute/jobs/deep_picker/deep_picker_utils.py", line 521, in cryosparc_master.cryosparc_compute.jobs.deep_picker.deep_picker_utils.get_dataset_from_particle_centers
ValueError: need more than 1 value to unpack
set status to failed
========= main process now complete at 2023-11-28 13:57:24.522314.
========= monitor process now complete at 2023-11-28 13:57:24.526035.

What Boszlacs (and potentially gha) describe is the same as what I am experiencing, most likely the same cause/underlying reason for this error.

I can confirm that the workaround suggested by prash did not work for me, aside from the fact that so far I have not come to understand how this parameter addresses the raised issue. Before I start diving into the utilitis script of the deep picker, I wanted to first consult the CryoSPARC discussion/forum.

Please let me know if more information is required. Working with the Deep Picker of CryoSPARC appears to be difficult. Talking to other colleagues, the notion seems to be that many have troubles to get it to run and have refrained from it. Since the Training looks quite promising, I am motivated to get the Deep Picker to work, even just for curiosity of its performance compared to alternatives.

This time I will try to remain engaged and respond timely.

Thanks again and best regards
Dennis

Hi @D_E_N_N_I_S.
Unfortunately, we are not sure what caused this error. May I suggest Topaz (github, wrapper docs) as an alternative approach for deep picking.

Ok, nonetheless, thank you for looking into it.

Actually, I have already tested Topaz and found it to perform not well. The training statistics already indicated poor performance of Topaz. Currently I am with crYOLO which performs much better than Blob, Template, Filament tracer, and Topaz. Only the Deep Picker I have not tested, since its training looked so promising, I wanted to test it. But the effort to get it to run seems not worth it anyway…

Thanks again!
Dennis