Hi,
Thanks for your reply!
I checked the job.log file and cannot find that error. There are some memory warnings at the end though:
================= CRYOSPARCW ======= 2023-03-21 10:37:51.918938 =========
Project P35 Job J34
Master hulk Port 39002
===========================================================================
========= monitor process now starting main process at 2023-03-21 10:37:51.918970
MAINPROCESS PID 1008998
========= monitor process now waiting for main process
MAIN PID 1008998
deep_picker.run_deep_picker cryosparc_compute.jobs.jobregister
2023-03-21 10:37:55.205472: I tensorflow/stream_executor/platform/default/dso_loader.cc:49] Successfully opened dynamic library libcudart.so.11.0
2023-03-21 10:37:58.744436: I tensorflow/compiler/jit/xla_cpu_device.cc:41] Not creating XLA devices, tf_xla_enable_xla_devices not set
2023-03-21 10:37:58.745804: I tensorflow/stream_executor/platform/default/dso_loader.cc:49] Successfully opened dynamic library libcuda.so.1
2023-03-21 10:37:58.812148: I tensorflow/core/common_runtime/gpu/gpu_device.cc:1720] Found device 0 with properties:
pciBusID: 0000:01:00.0 name: NVIDIA GeForce RTX 3090 computeCapability: 8.6
coreClock: 1.695GHz coreCount: 82 deviceMemorySize: 23.70GiB deviceMemoryBandwidth: 871.81GiB/s
2023-03-21 10:37:58.813368: I tensorflow/core/common_runtime/gpu/gpu_device.cc:1720] Found device 1 with properties:
pciBusID: 0000:25:00.0 name: NVIDIA GeForce RTX 3090 computeCapability: 8.6
coreClock: 1.695GHz coreCount: 82 deviceMemorySize: 23.70GiB deviceMemoryBandwidth: 871.81GiB/s
2023-03-21 10:37:58.814568: I tensorflow/core/common_runtime/gpu/gpu_device.cc:1720] Found device 2 with properties:
pciBusID: 0000:c1:00.0 name: NVIDIA GeForce RTX 3090 computeCapability: 8.6
coreClock: 1.695GHz coreCount: 82 deviceMemorySize: 23.70GiB deviceMemoryBandwidth: 871.81GiB/s
2023-03-21 10:37:58.815772: I tensorflow/core/common_runtime/gpu/gpu_device.cc:1720] Found device 3 with properties:
pciBusID: 0000:e1:00.0 name: NVIDIA GeForce RTX 3090 computeCapability: 8.6
coreClock: 1.695GHz coreCount: 82 deviceMemorySize: 23.70GiB deviceMemoryBandwidth: 871.81GiB/s
2023-03-21 10:37:58.815792: I tensorflow/stream_executor/platform/default/dso_loader.cc:49] Successfully opened dynamic library libcudart.so.11.0
2023-03-21 10:37:58.818758: I tensorflow/stream_executor/platform/default/dso_loader.cc:49] Successfully opened dynamic library libcublas.so.11
2023-03-21 10:37:58.818802: I tensorflow/stream_executor/platform/default/dso_loader.cc:49] Successfully opened dynamic library libcublasLt.so.11
2023-03-21 10:37:58.820567: I tensorflow/stream_executor/platform/default/dso_loader.cc:49] Successfully opened dynamic library libcufft.so.10
2023-03-21 10:37:58.820777: I tensorflow/stream_executor/platform/default/dso_loader.cc:49] Successfully opened dynamic library libcurand.so.10
2023-03-21 10:37:58.822218: I tensorflow/stream_executor/platform/default/dso_loader.cc:49] Successfully opened dynamic library libcusolver.so.10
2023-03-21 10:37:58.822942: I tensorflow/stream_executor/platform/default/dso_loader.cc:49] Successfully opened dynamic library libcusparse.so.11
2023-03-21 10:37:58.823063: I tensorflow/stream_executor/platform/default/dso_loader.cc:49] Successfully opened dynamic library libcudnn.so.8
2023-03-21 10:37:58.832745: I tensorflow/core/common_runtime/gpu/gpu_device.cc:1862] Adding visible gpu devices: 0, 1, 2, 3
2023-03-21 10:37:58.833281: I tensorflow/core/platform/cpu_feature_guard.cc:142] This TensorFlow binary is optimized with oneAPI Deep Neural Network Library (oneDNN) to use the following CPU instructions in performance-critical operations: AVX2 FMA
To enable them in other operations, rebuild TensorFlow with the appropriate compiler flags.
2023-03-21 10:37:58.840840: I tensorflow/compiler/jit/xla_gpu_device.cc:99] Not creating XLA devices, tf_xla_enable_xla_devices not set
2023-03-21 10:37:58.842174: I tensorflow/core/common_runtime/gpu/gpu_device.cc:1720] Found device 0 with properties:
pciBusID: 0000:01:00.0 name: NVIDIA GeForce RTX 3090 computeCapability: 8.6
coreClock: 1.695GHz coreCount: 82 deviceMemorySize: 23.70GiB deviceMemoryBandwidth: 871.81GiB/s
2023-03-21 10:37:58.842204: I tensorflow/stream_executor/platform/default/dso_loader.cc:49] Successfully opened dynamic library libcudart.so.11.0
2023-03-21 10:37:58.842236: I tensorflow/stream_executor/platform/default/dso_loader.cc:49] Successfully opened dynamic library libcublas.so.11
2023-03-21 10:37:58.842249: I tensorflow/stream_executor/platform/default/dso_loader.cc:49] Successfully opened dynamic library libcublasLt.so.11
2023-03-21 10:37:58.842262: I tensorflow/stream_executor/platform/default/dso_loader.cc:49] Successfully opened dynamic library libcufft.so.10
2023-03-21 10:37:58.842274: I tensorflow/stream_executor/platform/default/dso_loader.cc:49] Successfully opened dynamic library libcurand.so.10
2023-03-21 10:37:58.842286: I tensorflow/stream_executor/platform/default/dso_loader.cc:49] Successfully opened dynamic library libcusolver.so.10
2023-03-21 10:37:58.842298: I tensorflow/stream_executor/platform/default/dso_loader.cc:49] Successfully opened dynamic library libcusparse.so.11
2023-03-21 10:37:58.842309: I tensorflow/stream_executor/platform/default/dso_loader.cc:49] Successfully opened dynamic library libcudnn.so.8
2023-03-21 10:37:58.844671: I tensorflow/core/common_runtime/gpu/gpu_device.cc:1862] Adding visible gpu devices: 0
2023-03-21 10:37:58.844708: I tensorflow/stream_executor/platform/default/dso_loader.cc:49] Successfully opened dynamic library libcudart.so.11.0
2023-03-21 10:37:59.304435: I tensorflow/core/common_runtime/gpu/gpu_device.cc:1261] Device interconnect StreamExecutor with strength 1 edge matrix:
2023-03-21 10:37:59.304499: I tensorflow/core/common_runtime/gpu/gpu_device.cc:1267] 0
2023-03-21 10:37:59.304506: I tensorflow/core/common_runtime/gpu/gpu_device.cc:1280] 0: N
2023-03-21 10:37:59.308668: I tensorflow/core/common_runtime/gpu/gpu_device.cc:1406] Created TensorFlow device (/job:localhost/replica:0/task:0/device:GPU:0 with 128 MB memory) -> physical GPU (device: 0, name: NVIDIA GeForce RTX 3090, pci bus id: 0000:01:00.0, compute capability: 8.6)
WARNING:tensorflow:Error in loading the saved optimizer state. As a result, your model is starting with a freshly initialized optimizer.
2023-03-21 10:38:04.087770: I tensorflow/compiler/mlir/mlir_graph_optimization_pass.cc:116] None of the MLIR optimization passes are enabled (registered 2)
2023-03-21 10:38:04.107091: I tensorflow/core/platform/profile_utils/cpu_utils.cc:112] CPU Frequency: 2499920000 Hz
2023-03-21 10:38:04.974445: I tensorflow/stream_executor/platform/default/dso_loader.cc:49] Successfully opened dynamic library libcudnn.so.8
========= sending heartbeat at 2023-03-21 10:38:05.091907
2023-03-21 10:38:06.870181: W tensorflow/core/common_runtime/bfc_allocator.cc:248] Allocator (GPU_0_bfc) ran out of memory trying to allocate 302.29MiB with freed_by_count=0. The caller indicates that this is not a failure, but may mean that there could be performance gains if more memory were available.
2023-03-21 10:38:06.870266: W tensorflow/core/common_runtime/bfc_allocator.cc:248] Allocator (GPU_0_bfc) ran out of memory trying to allocate 302.29MiB with freed_by_count=0. The caller indicates that this is not a failure, but may mean that there could be performance gains if more memory were available.
2023-03-21 10:38:06.870568: I tensorflow/stream_executor/platform/default/dso_loader.cc:49] Successfully opened dynamic library libcublas.so.11
2023-03-21 10:38:07.551969: I tensorflow/stream_executor/platform/default/dso_loader.cc:49] Successfully opened dynamic library libcublasLt.so.11
2023-03-21 10:38:07.555270: W tensorflow/core/common_runtime/bfc_allocator.cc:248] Allocator (GPU_0_bfc) ran out of memory trying to allocate 548.13MiB with freed_by_count=0. The caller indicates that this is not a failure, but may mean that there could be performance gains if more memory were available.
2023-03-21 10:38:07.555307: W tensorflow/core/common_runtime/bfc_allocator.cc:248] Allocator (GPU_0_bfc) ran out of memory trying to allocate 548.13MiB with freed_by_count=0. The caller indicates that this is not a failure, but may mean that there could be performance gains if more memory were available.
2023-03-21 10:38:07.558189: W tensorflow/core/common_runtime/bfc_allocator.cc:248] Allocator (GPU_0_bfc) ran out of memory trying to allocate 88.00MiB with freed_by_count=0. The caller indicates that this is not a failure, but may mean that there could be performance gains if more memory were available.
2023-03-21 10:38:07.558229: W tensorflow/core/common_runtime/bfc_allocator.cc:248] Allocator (GPU_0_bfc) ran out of memory trying to allocate 88.00MiB with freed_by_count=0. The caller indicates that this is not a failure, but may mean that there could be performance gains if more memory were available.
2023-03-21 10:38:07.587943: W tensorflow/core/common_runtime/bfc_allocator.cc:248] Allocator (GPU_0_bfc) ran out of memory trying to allocate 592.14MiB with freed_by_count=0. The caller indicates that this is not a failure, but may mean that there could be performance gains if more memory were available.
2023-03-21 10:38:07.588032: W tensorflow/core/common_runtime/bfc_allocator.cc:248] Allocator (GPU_0_bfc) ran out of memory trying to allocate 592.14MiB with freed_by_count=0. The caller indicates that this is not a failure, but may mean that there could be performance gains if more memory were available.
2023-03-21 10:38:07.601447: W tensorflow/core/common_runtime/bfc_allocator.cc:248] Allocator (GPU_0_bfc) ran out of memory trying to allocate 548.16MiB with freed_by_count=0. The caller indicates that this is not a failure, but may mean that there could be performance gains if more memory were available.
2023-03-21 10:38:07.601483: W tensorflow/core/common_runtime/bfc_allocator.cc:248] Allocator (GPU_0_bfc) ran out of memory trying to allocate 548.16MiB with freed_by_count=0. The caller indicates that this is not a failure, but may mean that there could be performance gains if more memory were available.
***************************************************************
Running job on hostname %s 11.0.0.2
Allocated Resources : {'fixed': {'SSD': False}, 'hostname': '11.0.0.2', 'lane': 'echo', 'lane_type': 'node', 'license': True, 'licenses_acquired': 1, 'slots': {'CPU': [0], 'GPU': [0], 'RAM': [0]}, 'target': {'cache_path': '/scratch/cryosparc_cache', 'cache_quota_mb': None, 'cache_reserve_mb': 10000, 'desc': None, 'gpus': [{'id': 0, 'mem': 25447170048, 'name': 'NVIDIA GeForce RTX 3090'}, {'id': 1, 'mem': 25447170048, 'name': 'NVIDIA GeForce RTX 3090'}, {'id': 2, 'mem': 25447170048, 'name': 'NVIDIA GeForce RTX 3090'}, {'id': 3, 'mem': 25447170048, 'name': 'NVIDIA GeForce RTX 3090'}], 'hostname': '11.0.0.2', 'lane': 'echo', 'monitor_port': None, 'name': '11.0.0.2', 'resource_fixed': {'SSD': True}, 'resource_slots': {'CPU': [0, 1, 2, 3, 4, 5, 6, 7, 8, 9, 10, 11, 12, 13, 14, 15, 16, 17, 18, 19, 20, 21, 22, 23, 24, 25, 26, 27, 28, 29, 30, 31, 32, 33, 34, 35, 36, 37, 38, 39, 40, 41, 42, 43, 44, 45, 46, 47, 48, 49, 50, 51, 52, 53, 54, 55, 56, 57, 58, 59, 60, 61, 62, 63, 64, 65, 66, 67, 68, 69, 70, 71, 72, 73, 74, 75, 76, 77, 78, 79, 80, 81, 82, 83, 84, 85, 86, 87, 88, 89, 90, 91, 92, 93, 94, 95, 96, 97, 98, 99, 100, 101, 102, 103, 104, 105, 106, 107, 108, 109, 110, 111, 112, 113, 114, 115, 116, 117, 118, 119, 120, 121, 122, 123, 124, 125, 126, 127], 'GPU': [0, 1, 2, 3], 'RAM': [0, 1, 2, 3, 4, 5, 6, 7, 8, 9, 10, 11, 12, 13, 14, 15, 16, 17, 18, 19, 20, 21, 22, 23, 24, 25, 26, 27, 28, 29, 30, 31, 32, 33, 34, 35, 36, 37, 38, 39, 40, 41, 42, 43, 44, 45, 46, 47, 48, 49, 50, 51, 52, 53, 54, 55, 56, 57, 58, 59, 60, 61, 62, 63]}, 'ssh_str': 'cryosparcuser@11.0.0.2', 'title': 'Worker node 11.0.0.2', 'type': 'node', 'worker_bin_path': '/home/cryosparcuser/cryosparc/cryosparc_worker/bin/cryosparcw'}}
**** handle exception rc
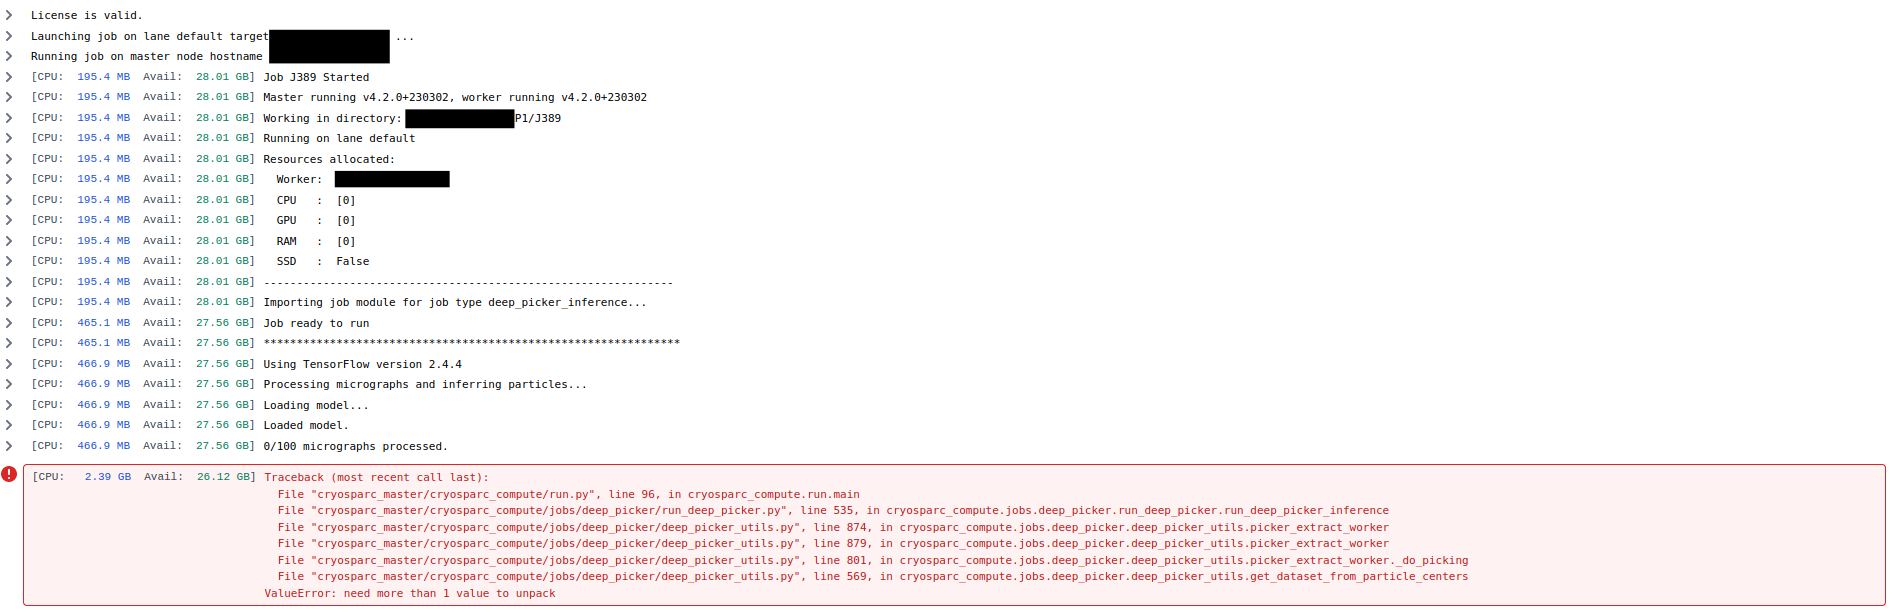
Traceback (most recent call last):
File "cryosparc_master/cryosparc_compute/run.py", line 96, in cryosparc_compute.run.main
File "cryosparc_master/cryosparc_compute/jobs/deep_picker/run_deep_picker.py", line 535, in cryosparc_compute.jobs.deep_picker.run_deep_picker.run_deep_picker_inference
File "cryosparc_master/cryosparc_compute/jobs/deep_picker/deep_picker_utils.py", line 874, in cryosparc_compute.jobs.deep_picker.deep_picker_utils.picker_extract_worker
File "cryosparc_master/cryosparc_compute/jobs/deep_picker/deep_picker_utils.py", line 879, in cryosparc_compute.jobs.deep_picker.deep_picker_utils.picker_extract_worker
File "cryosparc_master/cryosparc_compute/jobs/deep_picker/deep_picker_utils.py", line 801, in cryosparc_compute.jobs.deep_picker.deep_picker_utils.picker_extract_worker._do_picking
File "cryosparc_master/cryosparc_compute/jobs/deep_picker/deep_picker_utils.py", line 569, in cryosparc_compute.jobs.deep_picker.deep_picker_utils.get_dataset_from_particle_centers
ValueError: need more than 1 value to unpack
set status to failed
========= main process now complete at 2023-03-21 10:38:08.277377.
========= monitor process now complete at 2023-03-21 10:38:08.284964.