CUDA_ERROR_OUT_OF_MEMORY error - Live 2D classification

During 2D classification in cryoSPARC Live, I often get an error regarding memory issues. I have run in Low memory mode, reduced Output F-crop factor to 0.5, and still see the error. System details: v4.2.0, master-worker configuration, Ubuntu 18.04.4 LTS, CUDA Version: 10.1, 8 GPUs x GeForce RTX2080Ti

Similar error has also appeared in non-live cryoSPARC jobs.

Error message:

[CPU:  15.11 GB]
Traceback (most recent call last): File "/opt/cryosparc2_worker/cryosparc_compute/jobs/runcommon.py", line 2061, in run_with_except_hook run_old(*args, **kw) File "cryosparc_master/cryosparc_compute/engine/cuda_core.py", line 131, in cryosparc_compute.engine.cuda_core.GPUThread.run File "cryosparc_master/cryosparc_compute/engine/cuda_core.py", line 132, in cryosparc_compute.engine.cuda_core.GPUThread.run File "cryosparc_master/cryosparc_compute/engine/engine.py", line 1028, in cryosparc_compute.engine.engine.process.work File "cryosparc_master/cryosparc_compute/engine/engine.py", line 107, in cryosparc_compute.engine.engine.EngineThread.load_image_data_gpu File "cryosparc_master/cryosparc_compute/engine/gfourier.py", line 32, in cryosparc_compute.engine.gfourier.fft2_on_gpu_inplace File "/opt/cryosparc2_worker/cryosparc_compute/skcuda_internal/fft.py", line 115, in __init__ self.handle = gpufft.gpufft_get_plan( RuntimeError: cuda failure (driver API): cuMemAlloc(&plan_cache.plans[idx].workspace, plan_cache.plans[idx].worksz) -> CUDA_ERROR_OUT_OF_MEMORY out of memory

Output from nvidia-smi:

cryosparc@gpu01:/home/osu$ nvidia-smi
Wed Mar  8 10:30:24 2023
+-----------------------------------------------------------------------------+
| NVIDIA-SMI 418.56       Driver Version: 418.56       CUDA Version: 10.1     |
|-------------------------------+----------------------+----------------------+
| GPU  Name        Persistence-M| Bus-Id        Disp.A | Volatile Uncorr. ECC |
| Fan  Temp  Perf  Pwr:Usage/Cap|         Memory-Usage | GPU-Util  Compute M. |
|===============================+======================+======================|
|   0  GeForce RTX 208...  On   | 00000000:1A:00.0 Off |                  N/A |
| 51%   83C    P2   210W / 250W |   8057MiB / 10989MiB |     99%      Default |
+-------------------------------+----------------------+----------------------+
|   1  GeForce RTX 208...  On   | 00000000:1B:00.0 Off |                  N/A |
| 28%   31C    P8    21W / 250W |     11MiB / 10989MiB |      0%      Default |
+-------------------------------+----------------------+----------------------+
|   2  GeForce RTX 208...  On   | 00000000:60:00.0 Off |                  N/A |
| 29%   28C    P8    18W / 250W |     11MiB / 10989MiB |      0%      Default |
+-------------------------------+----------------------+----------------------+
|   3  GeForce RTX 208...  On   | 00000000:61:00.0 Off |                  N/A |
| 28%   28C    P8     9W / 250W |     11MiB / 10989MiB |      0%      Default |
+-------------------------------+----------------------+----------------------+
|   4  GeForce RTX 208...  On   | 00000000:B1:00.0 Off |                  N/A |
| 29%   29C    P8    19W / 250W |     11MiB / 10989MiB |      0%      Default |
+-------------------------------+----------------------+----------------------+
|   5  GeForce RTX 208...  On   | 00000000:B2:00.0 Off |                  N/A |
| 29%   33C    P8    21W / 250W |     11MiB / 10989MiB |      0%      Default |
+-------------------------------+----------------------+----------------------+
|   6  GeForce RTX 208...  On   | 00000000:DA:00.0 Off |                  N/A |
| 28%   26C    P8    20W / 250W |     11MiB / 10989MiB |      0%      Default |
+-------------------------------+----------------------+----------------------+
|   7  GeForce RTX 208...  On   | 00000000:DB:00.0 Off |                  N/A |
| 29%   27C    P8    22W / 250W |     11MiB / 10989MiB |      0%      Default |
+-------------------------------+----------------------+----------------------+

Any recommendations would be appreciated.

Reposting error message

[CPU:  15.11 GB]
Traceback (most recent call last): 
File "/opt/cryosparc2_worker/cryosparc_compute/jobs/runcommon.py", line 2061, in run_with_except_hook run_old(*args, **kw) 
File "cryosparc_master/cryosparc_compute/engine/cuda_core.py", line 131, in cryosparc_compute.engine.cuda_core.GPUThread.run 
File "cryosparc_master/cryosparc_compute/engine/cuda_core.py", line 132, in cryosparc_compute.engine.cuda_core.GPUThread.run 
File "cryosparc_master/cryosparc_compute/engine/engine.py", line 1028, in cryosparc_compute.engine.engine.process.work
File "cryosparc_master/cryosparc_compute/engine/engine.py", line 107, in cryosparc_compute.engine.engine.EngineThread.load_image_data_gpu
File "cryosparc_master/cryosparc_compute/engine/gfourier.py", line 32, in cryosparc_compute.engine.gfourier.fft2_on_gpu_inplace 
File "/opt/cryosparc2_worker/cryosparc_compute/skcuda_internal/fft.py", line 115, in __init__ self.handle = gpufft.gpufft_get_plan( 
RuntimeError: cuda failure (driver API): cuMemAlloc(&plan_cache.plans[idx].workspace, plan_cache.plans[idx].worksz) -> CUDA_ERROR_OUT_OF_MEMORY out of memory

What were extraction box size, particle count and number of classes when cuMemAlloc failed?

Extraction box size: 256 px
Particle count: around 100,000 (did not document exact #)
Number of classes: 10

Is this memory used by a process related to the aforementioned CryoSPARC Live session? Could a collision between the CryoSPARC job and another compute load have caused the cuMemAlloc failure?

The memory shown is associated with the Live session. No other jobs are running at this time (or when the error appeared).

@ynarui Do you still have access to that Live session and can share a screenshot of the Compute Resources section of the Configuration tab?

Hi @wtempel ,

My group appears to be encountering a similar issue where a CryoSPARC process is trying to allocate more memory on a GPU than is available. So far we’ve been able to determine the following:

  • The cause isn’t due to F-crop settings; F-crop is not being used.
  • Low memory mode does not seem to help.
  • No other compute loads are contending for GPU RAM.

I tried looking for some logs to aid in troubleshooting, but it seems that these are deleted after a job ends? If I’m mistaken and jobs from CryoSPARC Live sessions are retained, where would they typically end up at?

Best,
John Pellman

@jpellman Please can you post additional details:

  1. the extraction box size of the particles
  2. output of the nvidia-smi command on the relevant GPU node
  3. any indication as to which processing step causes the issue
  4. screenshots of the UI that illustrate the error condition

@wtempel

Here’s the output of nvidia-smi during one of the times the cuMemAlloc occurred:

jpellman@cryosparc5-w1:~$ nvidia-smi                                                                                    
Fri Dec  1 13:33:11 2023                                                                                                +-----------------------------------------------------------------------------+
| NVIDIA-SMI 520.61.05    Driver Version: 520.61.05    CUDA Version: 11.8     |
|-------------------------------+----------------------+----------------------+
| GPU  Name        Persistence-M| Bus-Id        Disp.A | Volatile Uncorr. ECC |
| Fan  Temp  Perf  Pwr:Usage/Cap|         Memory-Usage | GPU-Util  Compute M. |
|                               |                      |               MIG M. |
|===============================+======================+======================|
|   0  NVIDIA GeForce ...  On   | 00000000:02:00.0 Off |                  N/A |
| 28%   33C    P2    45W / 180W |   8102MiB /  8192MiB |      0%      Default |
|                               |                      |                  N/A |
+-------------------------------+----------------------+----------------------+
|   1  NVIDIA GeForce ...  On   | 00000000:03:00.0 Off |                  N/A |
| 28%   36C    P8     7W / 180W |   8104MiB /  8192MiB |      0%      Default |
|                               |                      |                  N/A |
+-------------------------------+----------------------+----------------------+

+-----------------------------------------------------------------------------+
| Processes:                                                                  |
|  GPU   GI   CI        PID   Type   Process name                  GPU Memory |
|        ID   ID                                                   Usage      |
|=============================================================================|
|    0   N/A  N/A   1338998      C   python                           8098MiB |
|    1   N/A  N/A   1339107      C   python                           8098MiB |
+-----------------------------------------------------------------------------+
jpellman@cryosparc5-w1:~$ ps aux | grep python | grep cryo
cryospa+ 1338992  0.3  0.1 9431128 237736 ?      Sl   13:22   0:08 python -c import cryosparc_compute.run as run; run.run() --project P134 --job J52 --master_hostname cryosparc5.semc.nysbc.org --master_command_core_port 39002
cryospa+ 1338998 52.7  3.5 29034040 4669392 ?    Sl   13:22  22:11 python -c import cryosparc_compute.run as run; run.run() --project P134 --job J52 --master_hostname cryosparc5.semc.nysbc.org --master_command_core_port 39002
cryospa+ 1339098  0.3  0.1 9431132 238044 ?      Sl   13:22   0:08 python -c import cryosparc_compute.run as run; run.run() --project P134 --job J53 --master_hostname cryosparc5.semc.nysbc.org --master_command_core_port 39002
cryospa+ 1339107 53.7  3.2 28638696 4299692 ?    Sl   13:22  22:35 python -c import cryosparc_compute.run as run; run.run() --project P134 --job J53 --master_hostname cryosparc5.semc.nysbc.org --master_command_core_port 39002

This output reflects the fact that there were two jobs running on the node and that both of them failed with the same out of memory issue. The nvidia-smi output indicates that the memory usage was near capacity (as might be expected with a memory allocation error).

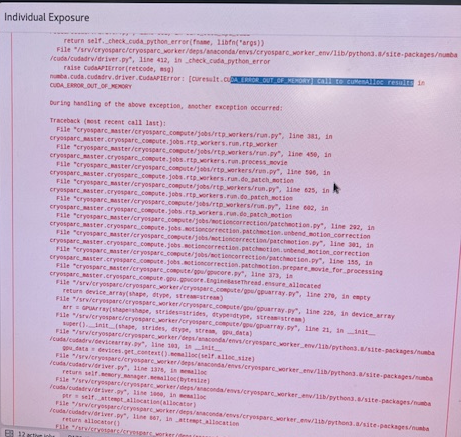
The error seems to occur during motion correction. Here’s a photo of the stack trace that was provided by our user:

image0

I do not know what the extraction box size was and the user has deleted the session. I can ask them to provide this window if/when they attempt to run CryoSPARC Live next.

–John

The calculation you are attempting may require GPU devices with more RAM. The current minimum configuration calls for at least 11 GB.